
Introduction
Welcome to the FiveHive article for AP Calculus Unit 1.3!
In this unit, we will explore how we can estimate limits from graphs.
As usual, we will only cover what is mentioned on the CED for Unit 1.3.
One-Sided Limits
Now that you are familiar with normal limit notation, the next step is to look at one sided limits. That is, the limit of a function at a certain value approaching from the left or the right. Understanding one sided limits is key to moving forward in this course, as it will be used to prove things like continuity and differentiability.
First let’s look at how a one sided limit is denoted:
And/or
.
If the value that is approaching has a as an superscript, that means we are approaching that value from the right. If the superscript is a , we are approaching from the left. can also be thought of as approaching values that are slightly above , hence it being a right-side limit. The ditto logic applies for , which can be thought of as approaching values slightly below , hence it being a left-side limit.
Limits From Graphs
Now that we have established an understanding of one sided limits, let us dive into the topic of the article: limits from graphs.
When given a question that requires you to determine the limit from the graph, the first step is to “trace” the function approaching a certain value from both the left and the right side.
Example 1:
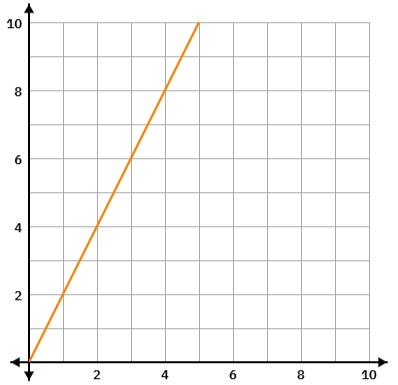
The graph of is shown above. Using the graph, find the .
Using the step mentioned above, we approach the -value, in this case , from both sides. This shows us that As a result, the answer to this question is , or .
In many simple limits like this one, the limit at some value is simply going to be . However, this is not going to be the case in all limits.
Example 2:
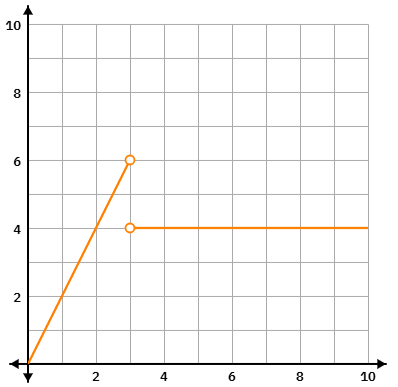
Once again, the graph of is shown above. Find .
The trick doesn’t work right? That’s because this is a piecewise function. With these, you have to find out the left and right limits. Only if they are equal, does the limit exist.
In this case, the left limit is and the right limit is . Since they are not equal, the limit does not exist (DNE for short), or is DNE.
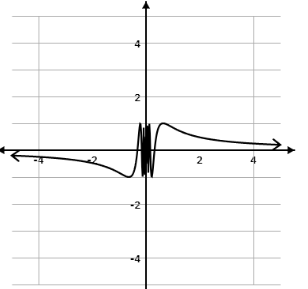
Another way a limit would not exist is if the function oscillates. Using a graphing calculator, the function (shown to the below) oscillates from to with increased frequency so it is impossible to determine a value for the limit at . The main way for a limit to not exist is that the left side and right side limits don’t equal each other, but that is not the only way.
Graphs are great, but graphs may miss some important details to do rendering or scaling issues. Thus, be careful when looking at graphs, as inaccuracies can be caused due to technological issues.
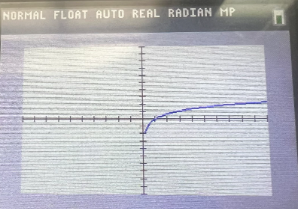
For example, this is the graph of on a TI-84.
The vertical asymptote at seems to be ‘missing’ because it looks like the function is approaching . Make sure to pay attention to the scale when using or reading graphs to determine a limit.
Practice
Time for practice! This was a relatively short unit, but very important. So, PRACTICE!