
Introduction
Hopefully by the end of this, you will be a master in the functions of Desmos by the end of this article.
For Desmos, this is the version of Desmos on the test:
https://www.desmos.com/testing/cb-sat-ap/graphing
Basic Functions
We will go over the basic functions: addition, multiplication, subtract, division, exponents, etc.
For addition, type the plus sign:
For subtraction, type the minus sign:
For multiplication, type the asterisk (*):
For division, type the slash (/):
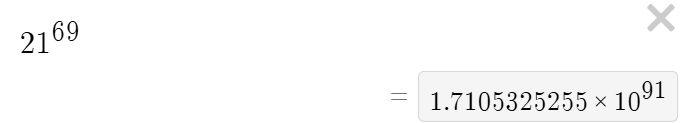
For exponents, type the carrot (shift 6) (^):
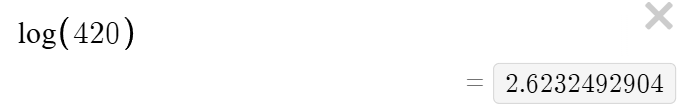
For logarithmic with a base of 10, type :
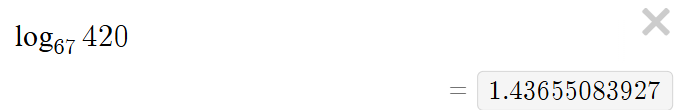
For a logarithmic with any other base, type , underscore (_), and list the base number:
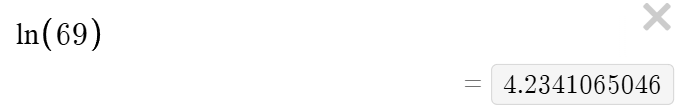
For natural log, type :
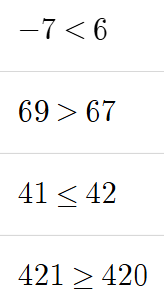
For inequalities, type less than (<), greater than (>), less than or equal to (<=), and greater than or equal to (>=):
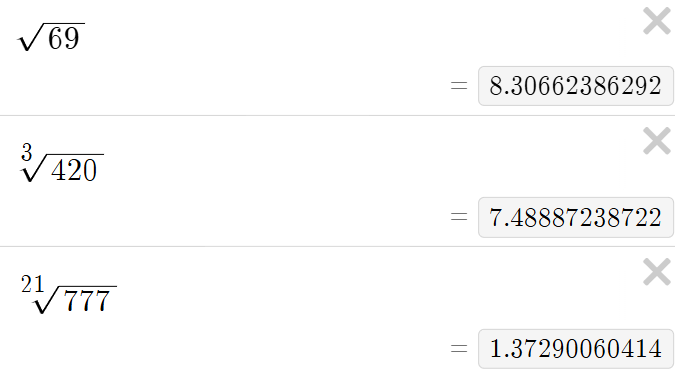
For roots, type "sqrt" for square roots, "cbrt" for cube roots, and "nthroot" for any root of index (ie ).
For the trig functions, type , , , , ,
Function Analysis & Trig
Now, we'll be going over how to analyze Desmos graphs.
The graph of .
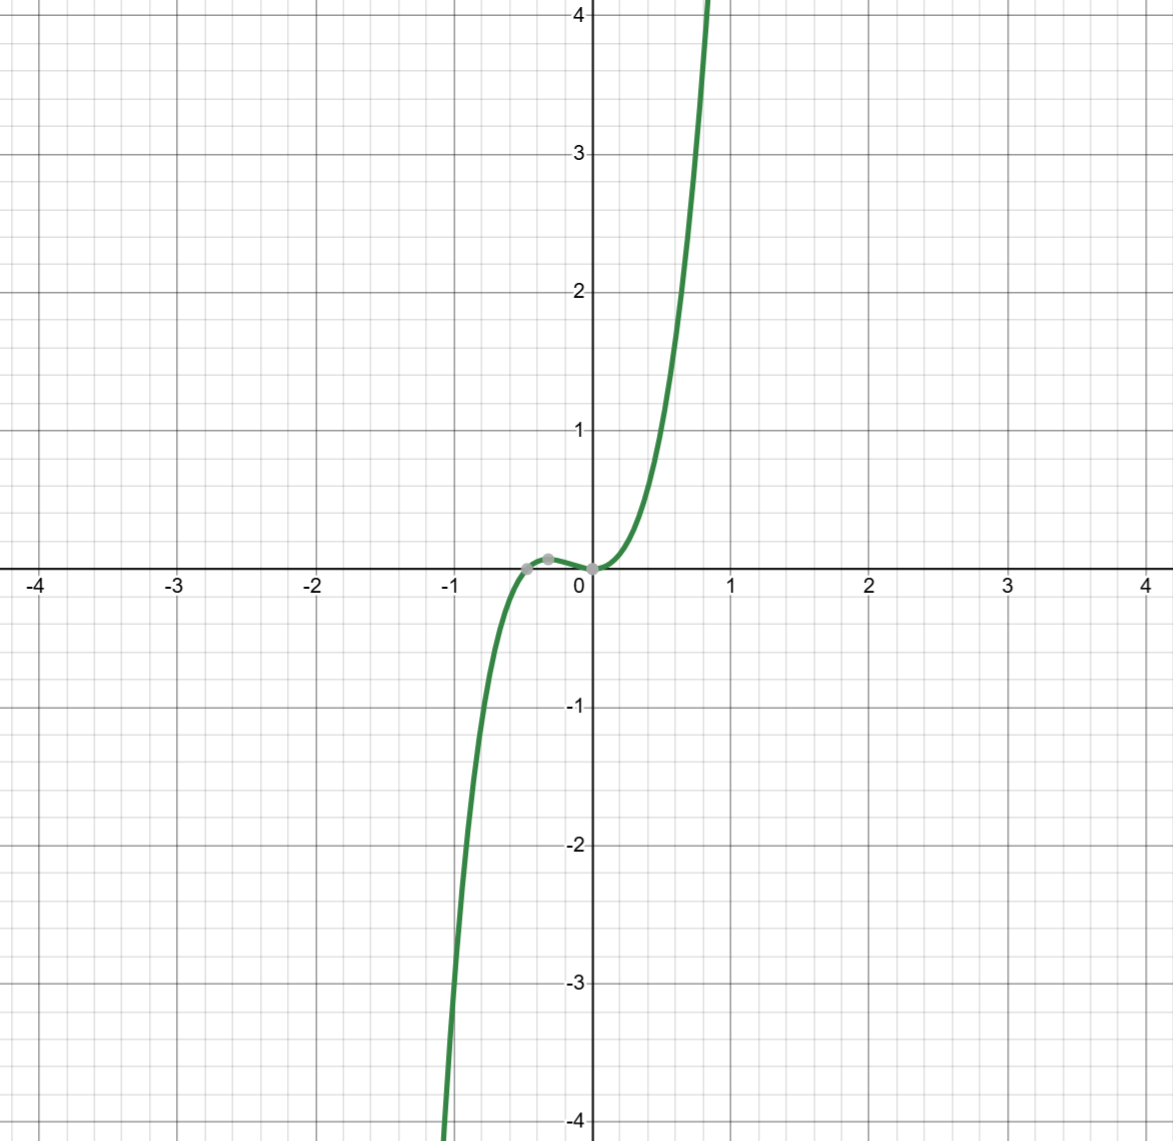
We see a few gray dots, let's zoom in on them. These gray dots are what Desmos considers important values.
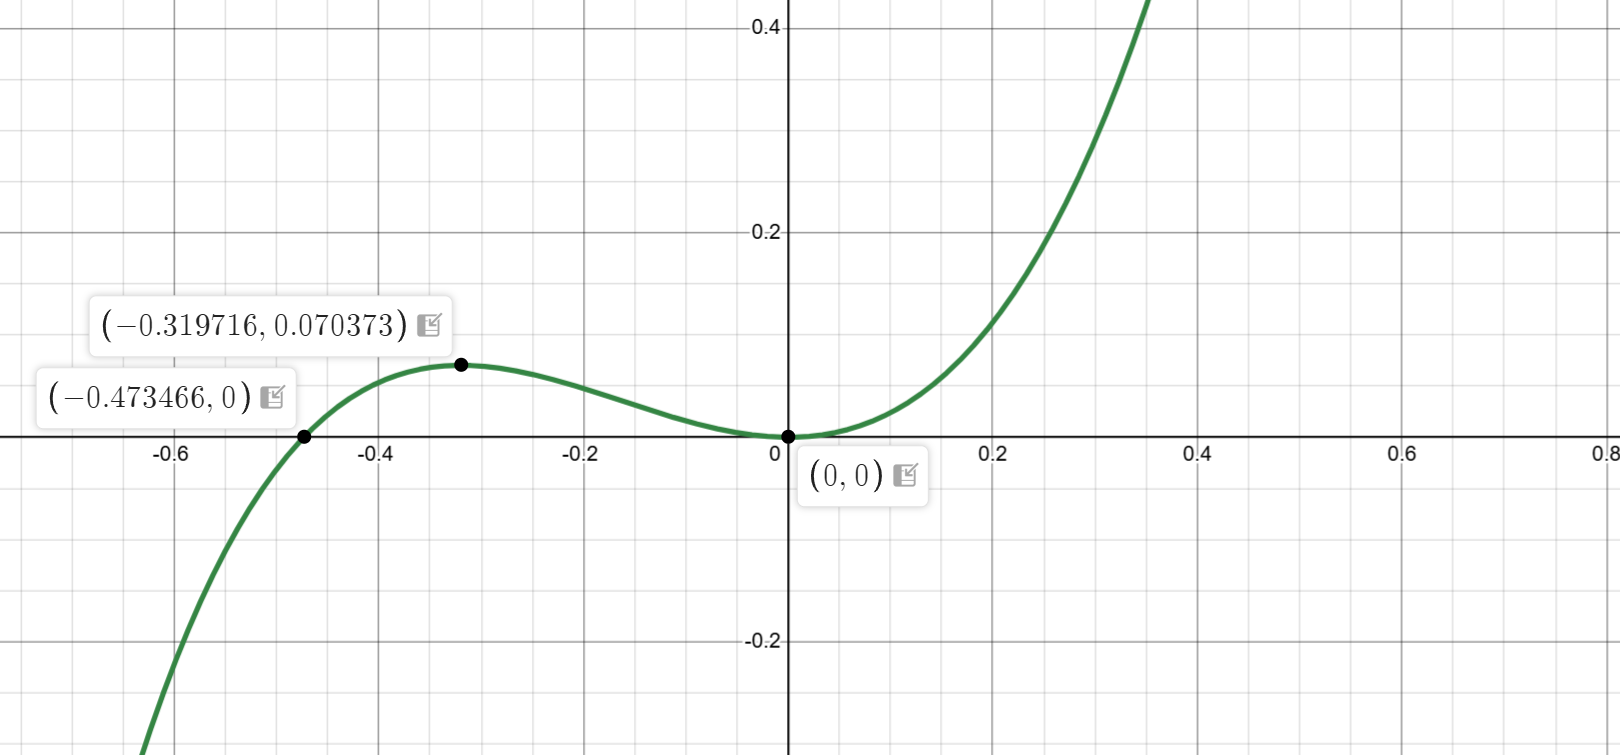
is a relative maxima because it is the highest point of the graph that doesn't go to infinity.
and are our -intercepts (roots, solutions, zeros)
is also our -intercept.
Specifically, it shows intersections with x-axis, y-axis, minimas, and maximas. It does not show you inflection points.
Also, we will examine a rational function:
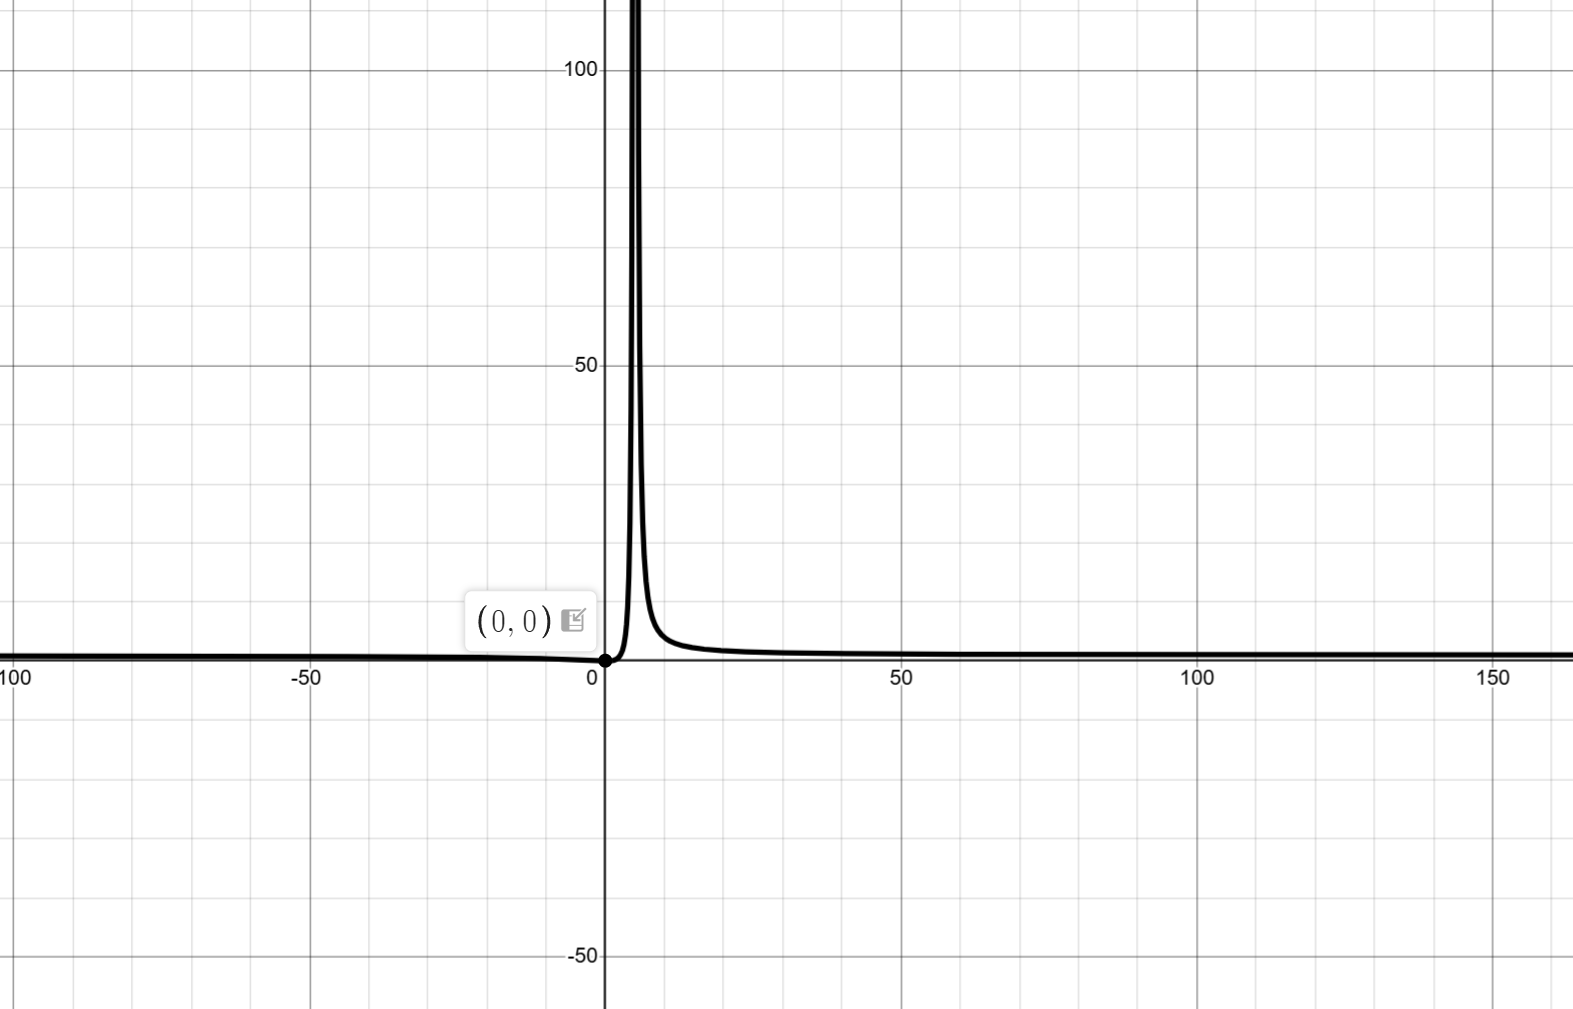
The graph of .
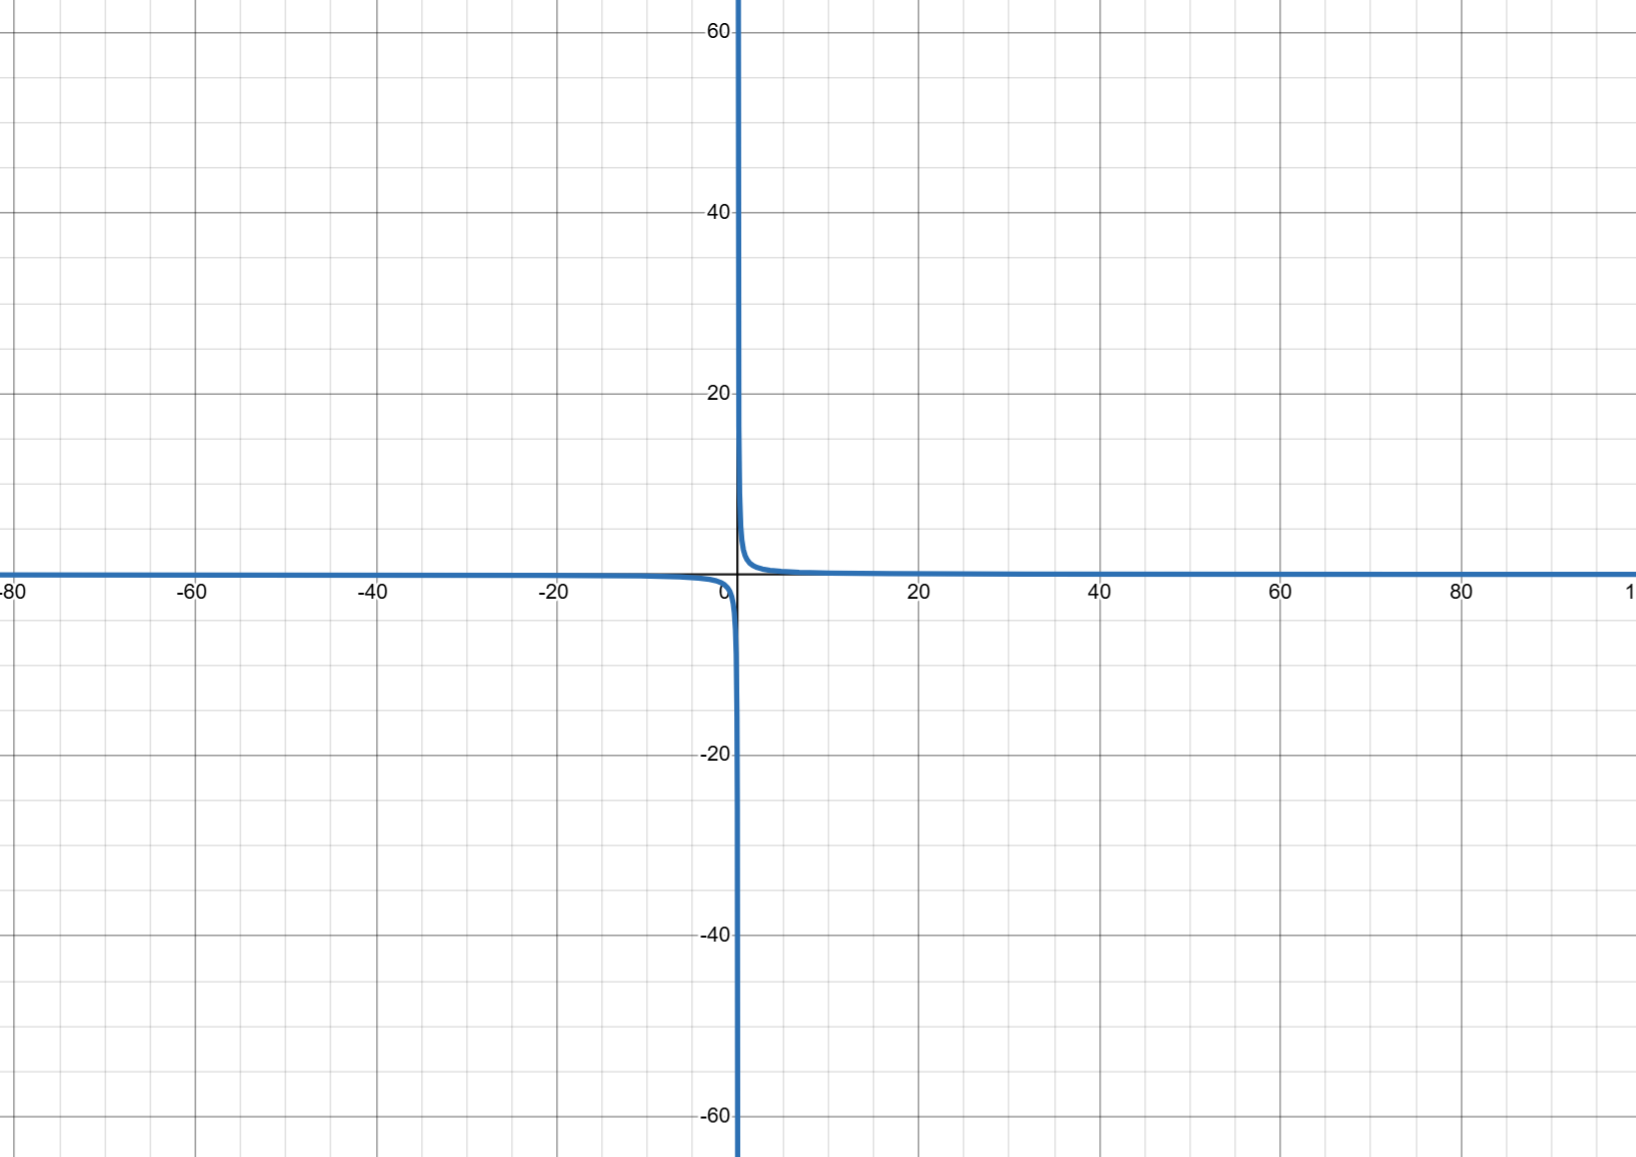
We see in this one that there is no gray dots at all!
This is because of asymptotes that while Desmos doesn't show directly, they can still be inferred. We see that at , our graph is just approaching it, but never crossing it.
This means it's a vertical asymptote, and thus we don't have any -intercepts.
Now, we also see that we don't have any -intercepts, which means we have a horizontal asymptote at .
Now, we are going to examine a trigonometric function.
The graph of .
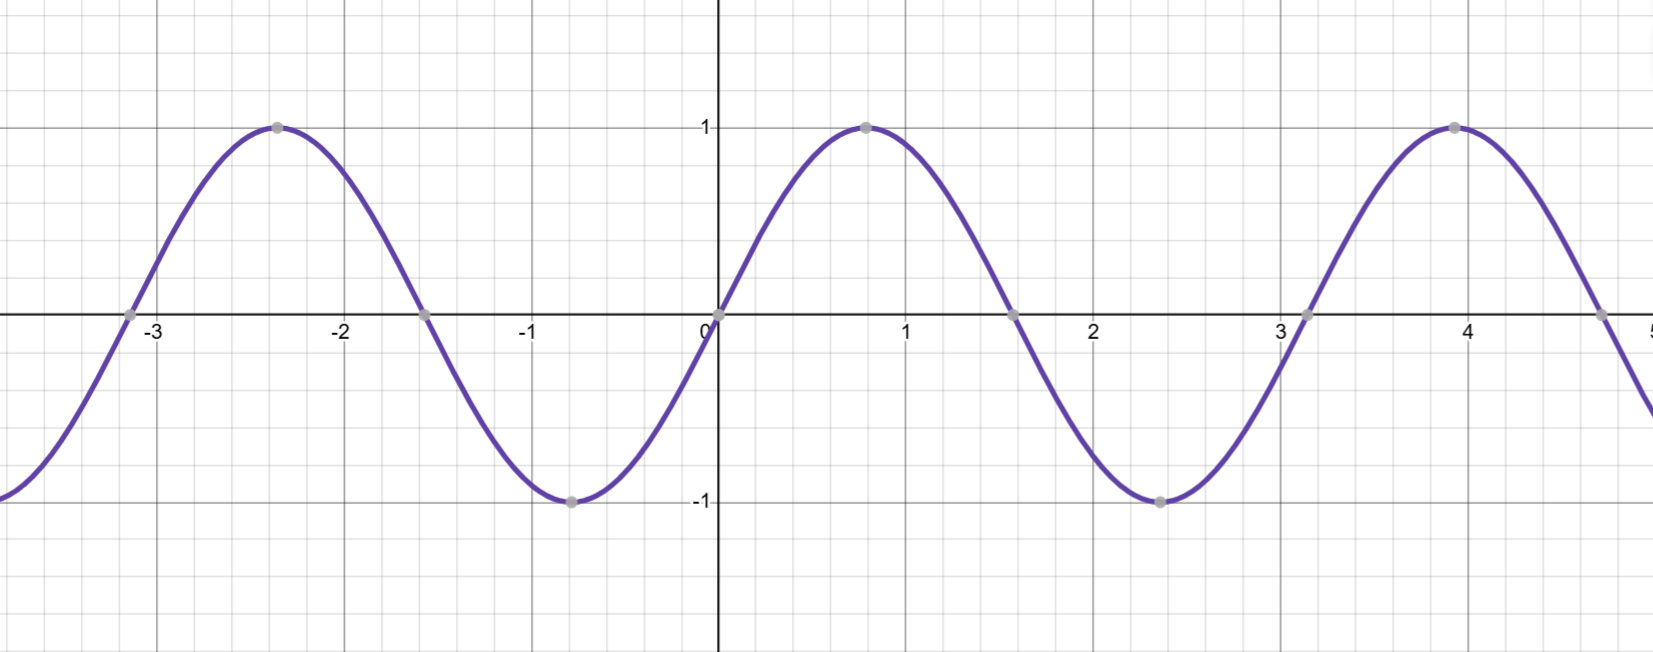
In this case, we have multiple gray dots, which repeat at a period of .
But in this, our ratios don't show nicely, so we are going to change the Desmos graph to instead showcase ratios instead of the current counting numbers we have.
We do this by clicking the wrench in the top right corner.

This opens up to a new menu:
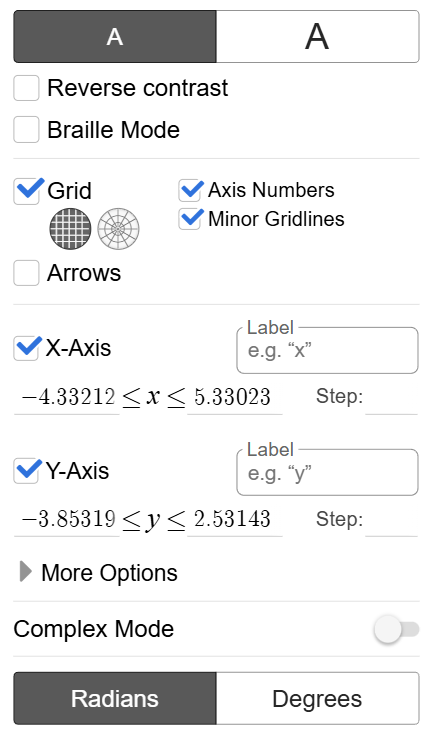
For trigonometry, I'd recommend changing it to a step of .
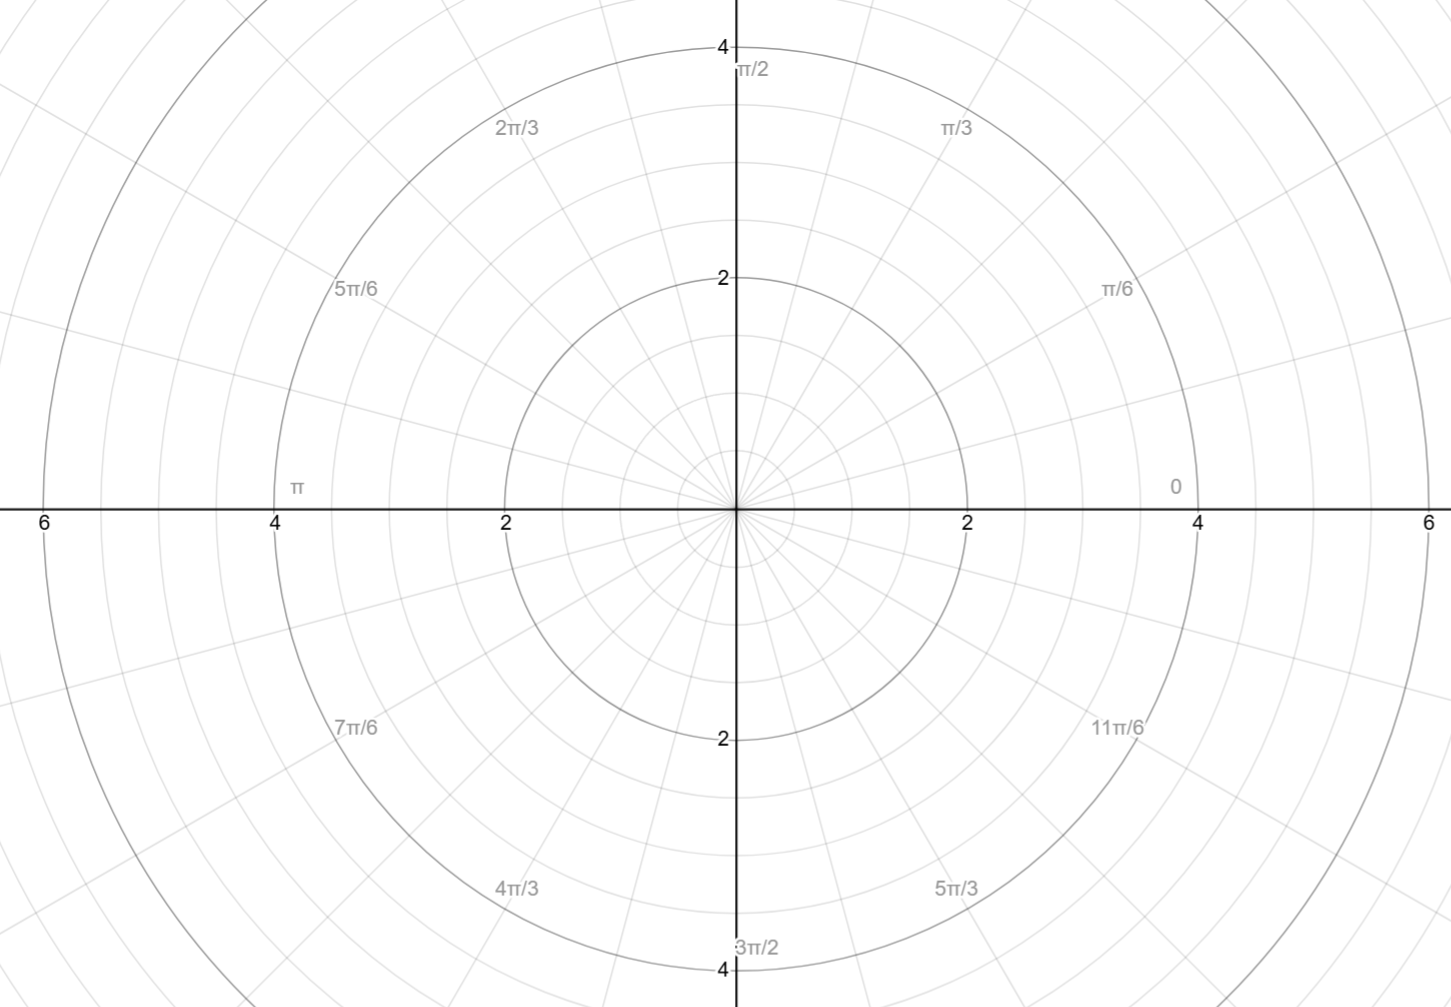
In this same menu, we can change it to polar, so click the second option of the grid (the polar plane):
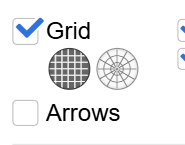
It will now look like this:
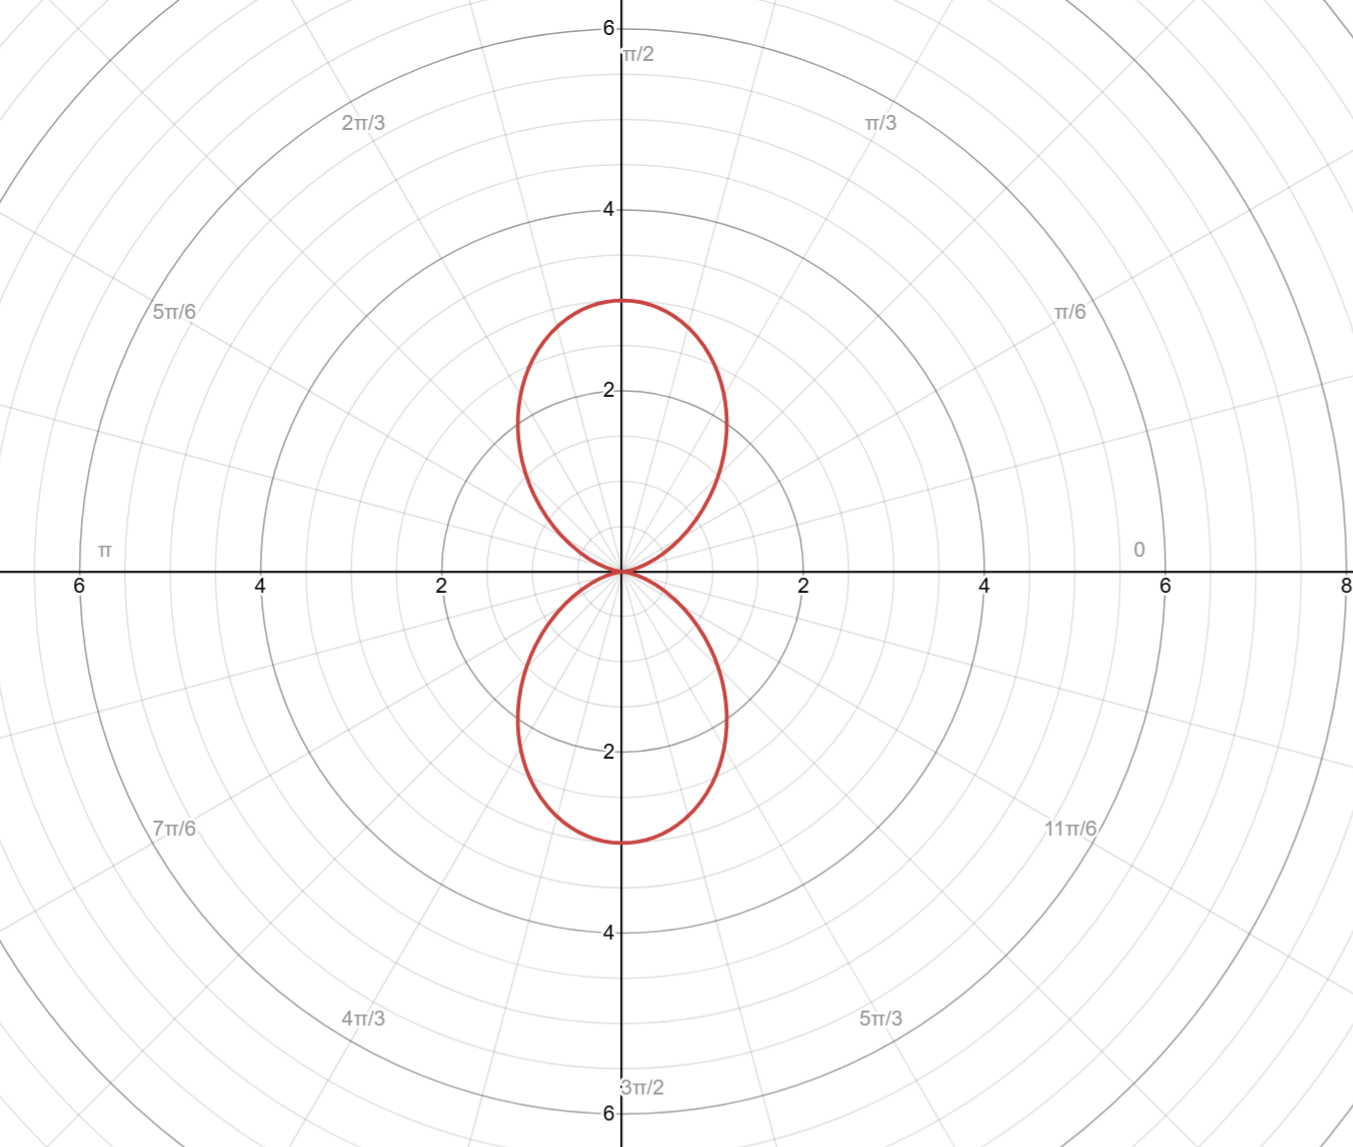
Now, you can plot the polar functions with ease. For example,
Input & Outputs
This section will be a brief section on and multiple ways to use it.
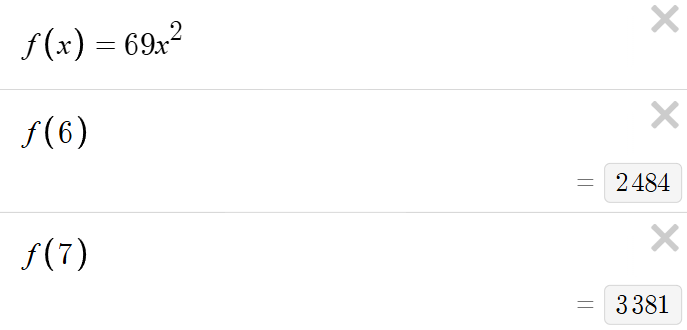
First, it can be used simply as way to plug in -values to get -values.
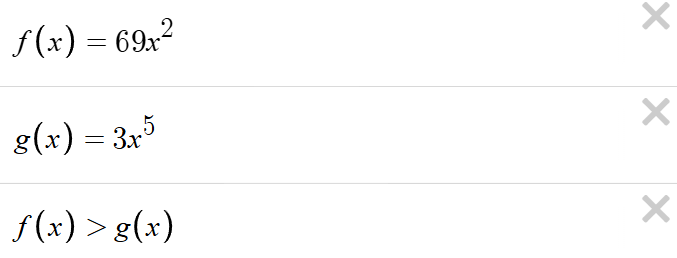
Next, it can be used as a way to compare functions with inequalities.
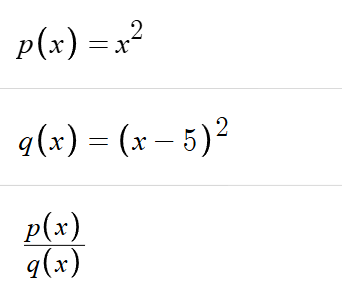
Then, it can also be used as a way to make a rational function, for example the question type of " is a polynomial and is another polynomial, what are the zeros of the rational function ?"
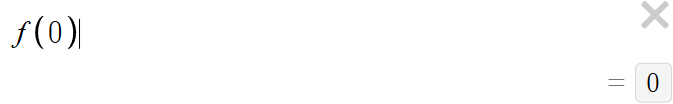
This graph shows us that at has a value of -value of .
We can also verify this by typing:
Finally, it can be used as a way to set a function equivalent to another value.
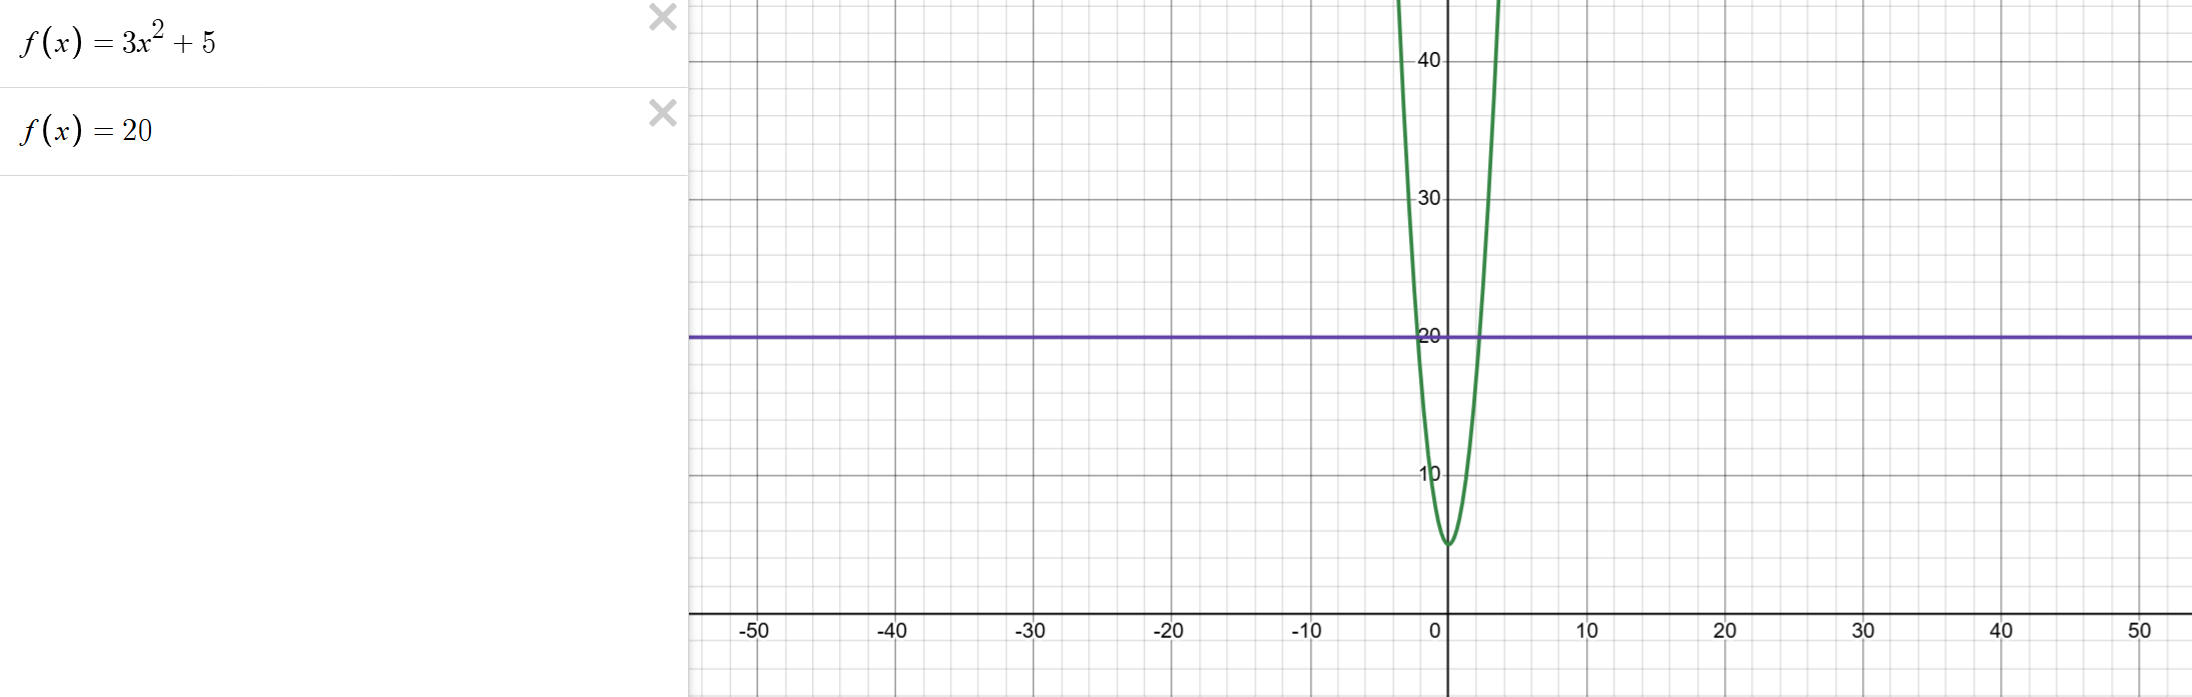
We can see where they intersect at the gray dots.
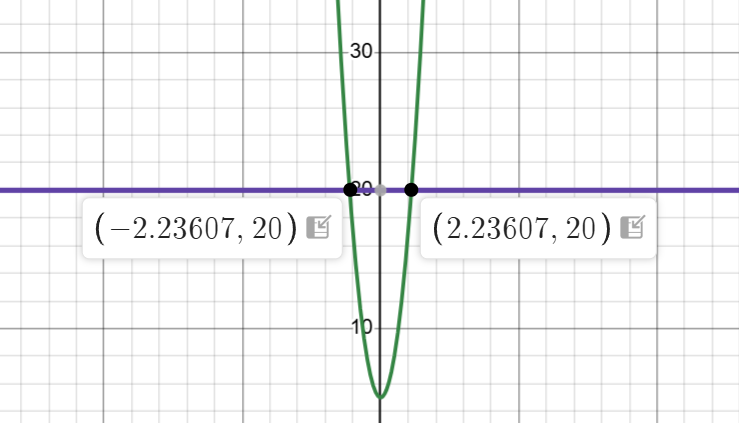
This means that at and .
Regressions
Our final section will be regressions, arguably the most important section of this guide, and the most useful for the 12 MCQ in the Calculator Section.
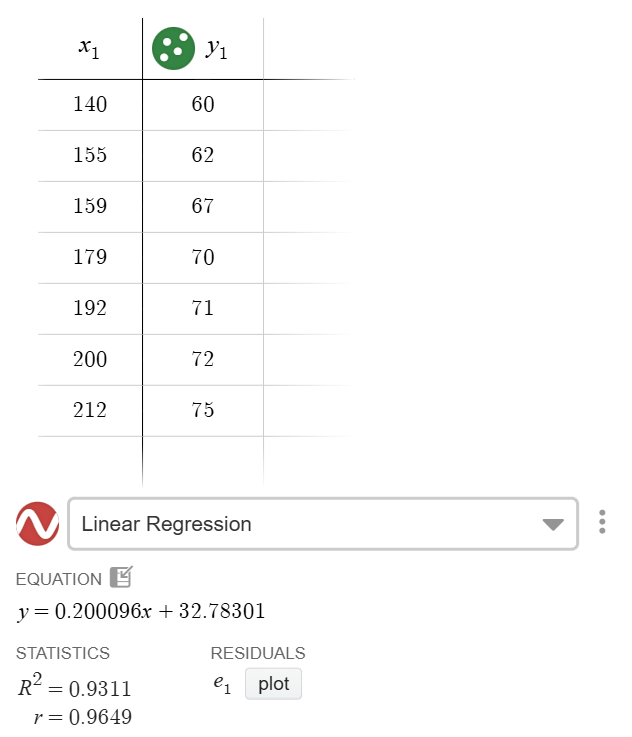
So first, we set up our regressions with a table.
We make this table by typing "table". It will then create a table.
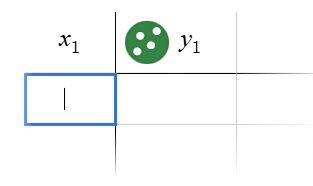
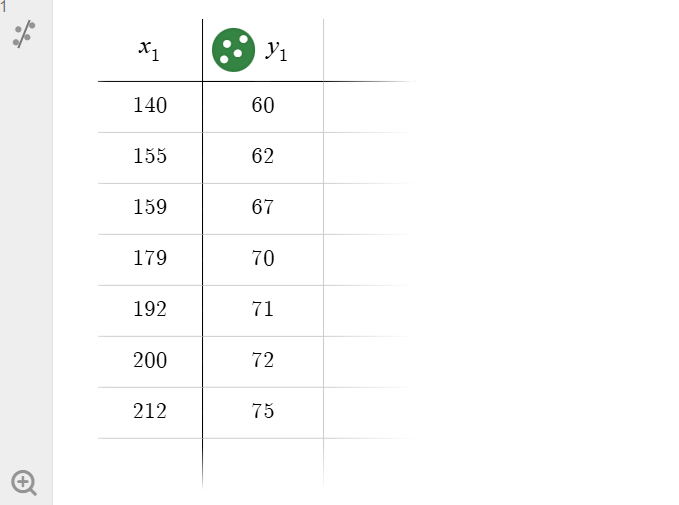
We enter our -values and -values.
Linear Regression
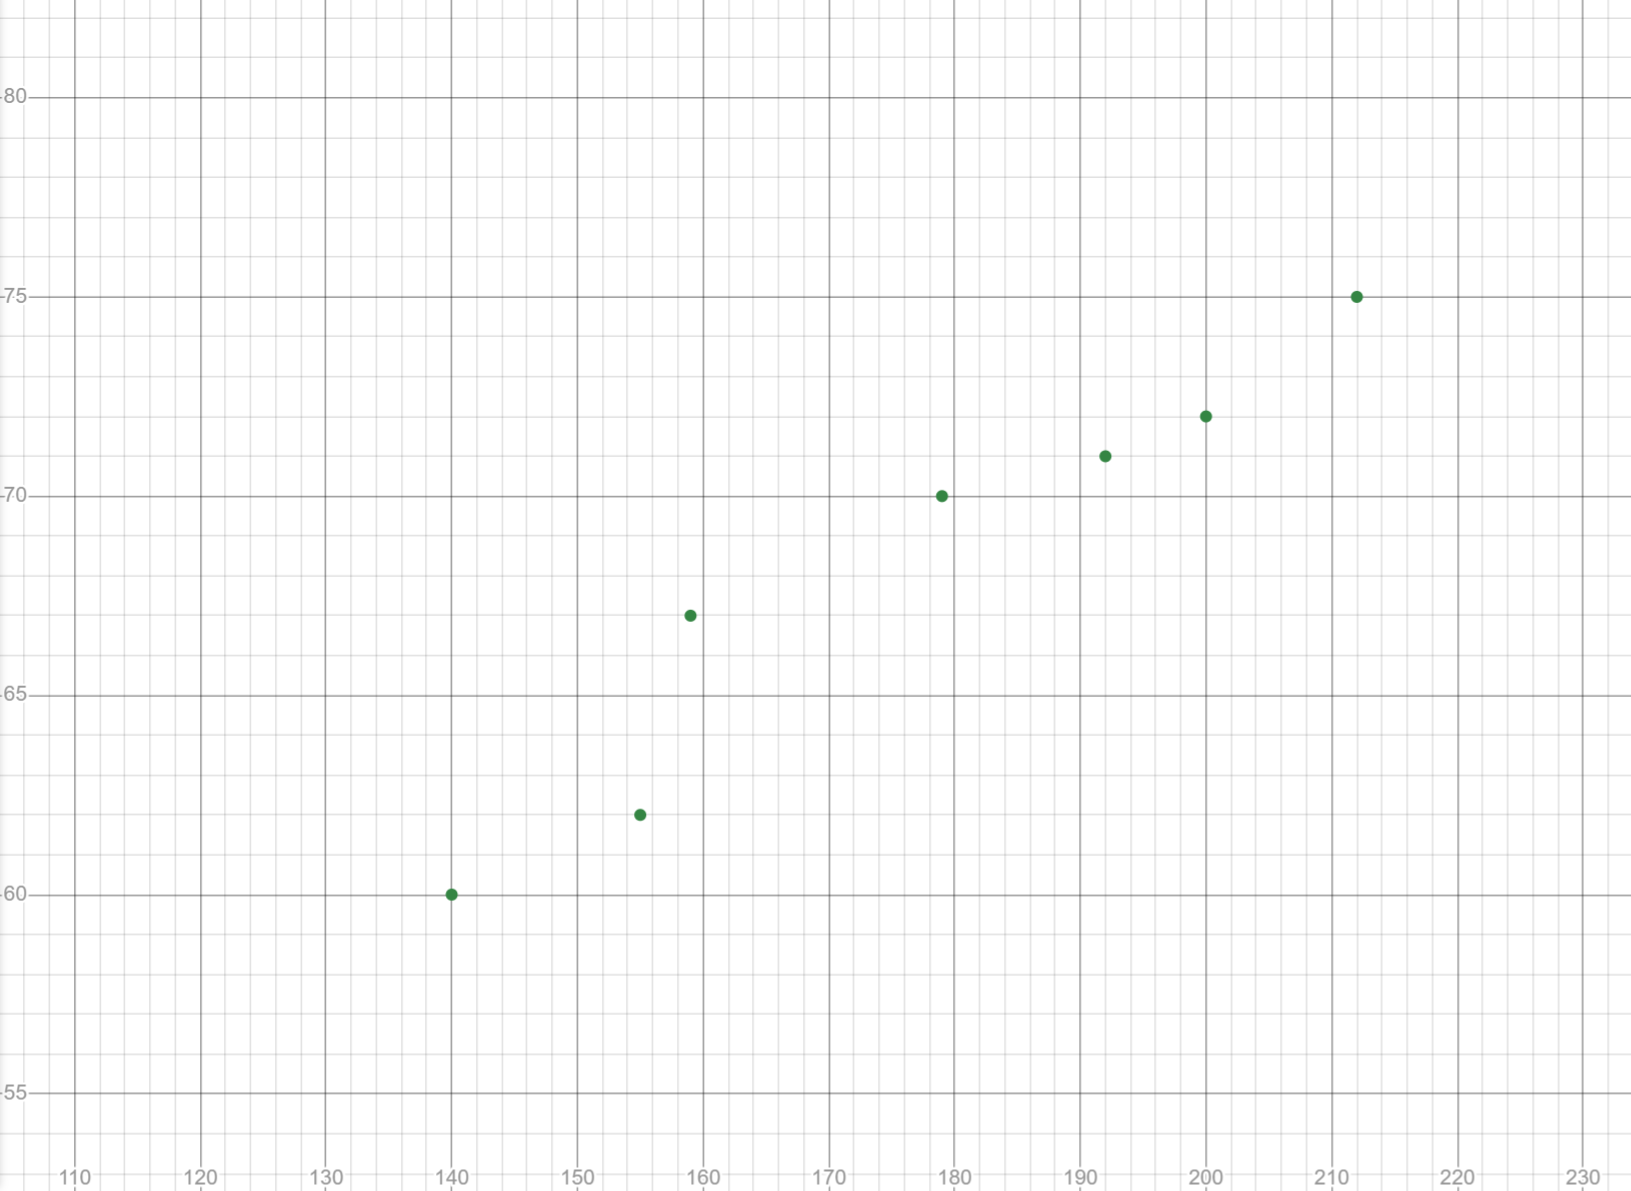
We will first click the magnifying glass.

This make our graph look like this:
Next, we will click the regression button.

It will create a linear regression automatically.
We can change the type of regression, by clicking on the drop down menu.

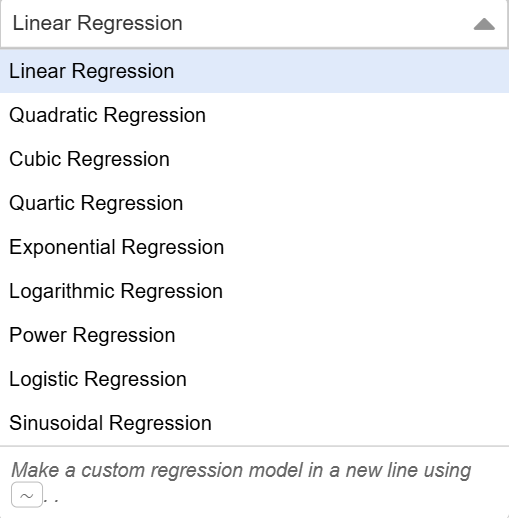
Now, from this, we can choose any of these depending on the data set given.
If we are given quadratic data, choose a quadratic function. If we are given an exponential data, choose an exponential function. And so on, and so forth.
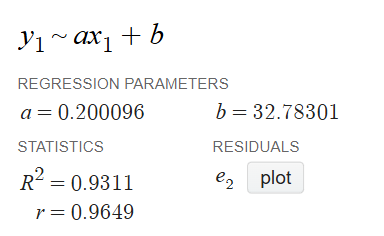
Custom Regressions
Finally, we can make custom regressions using this feature.
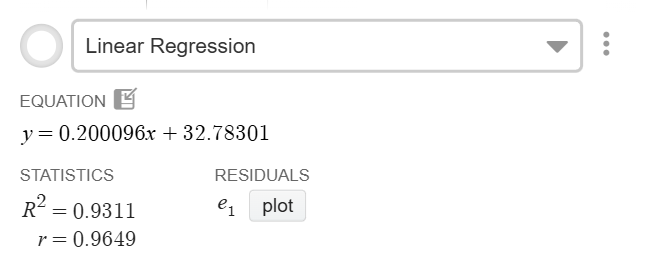
First, turn off the linear regression.
Then in a new line, type
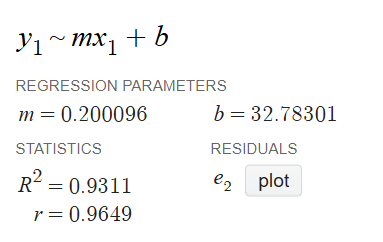
We can change our coefficients of this to help find any values (most useful on the DSAT).
Conclusion
This should be a comprehensive guide of everything you need to answer all Calculator questions on the AP Exam with the Desmos Calculator. If you are interested in learning how to use the Ti-84, check out the next article.