
Introduction
Hello there, how’s your day? Good? Bad? Well, I assume you are ready to learn Calculus because you clicked on this article, so welcome to another unit! In this new unit, we will be doing something very different yet quite similar in some sense. Remember derivatives? Well, now we are moving onto something called integrals!
What Are Integrals?
Integrals tell you what the area under a curve is! Now, I know you’re confused, so let’s dissect this.
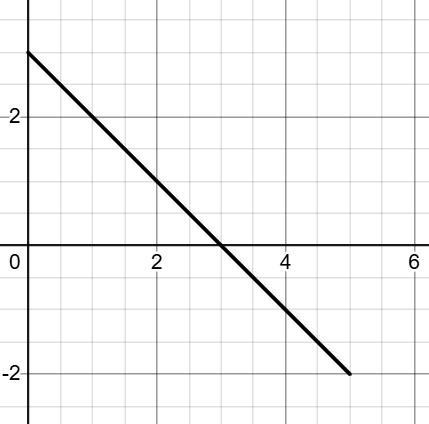
I am sure we are all very familiar with what an area is, like the area of a rectangle or circle. Same concepts here! Now, what do I mean by “under the curve”? Well, if you look at a graph, you can imagine that it has an area. Ok, maybe you need some visuals. Here you go!

By “area under the curve”, we mean this! Notice that the area is bordered by the graph and the x-axis. If we were to find this area, then we can… do what?
Meaning of the Integral
Whenever you have a graph that involves an integral, you can assume that it is working with the rate of change function. We will get into why in the future, but understand that the graph is always the rate of change.
If the graph represents the rate of change, then the area represents the accumulation of change! What does this even mean though?

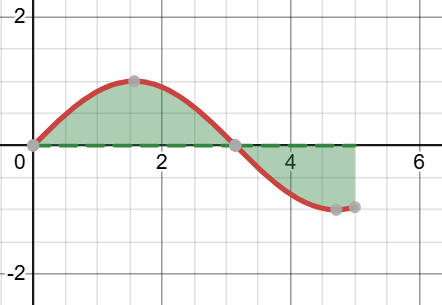
Let’s imagine that this graph tells you your speed because it is the rate of change function. When the graph is in the negatives, you are moving backwards, and when the graph is in the positives, you are moving forwards. Guess what? The area under the curve is actually the distance you travel in this context!
You may realize that the green area that is below the -axis is negative, and you would be right! If the rate of change is negative, then the area under the curve in that interval is also negative!
We are moving forwards from the interval because the rate of change is positive from and so it makes sense that the area under the curve is also positive from . Vice versa, the rate of change graph is negative from and so it would make sense to say that we are moving backwards from and that our area is negative from .
Basically, positive graph, positive area, negative graph, negative area!
Example 1:
Find how far the car has traveled from its starting point from the interval if the rate of change of the car is given by the graph below:
Let’s analyze this situation. This graph gives us the car’s velocity, and we have a moment when the car is moving forwards and when the car is moving backwards. We can say that the displacement is simply the area below the curve.
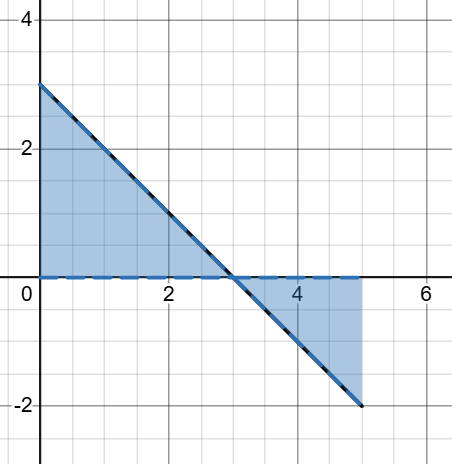
For the moment that it is moving forwards, we can calculate that into one part and for the moment that it is moving backwards, we can calculate that into another part! Notice that we have two distinct triangles, and so maybe we can find out the distance traveled by the car by using some simple geometry.
For the first triangle from the interval , we have a triangle with a height of and a base of . If we use the formula , we get . We can now say that from the interval , we moved forward a distance of units.
For the second triangle below the graph, we can use the same principle and figure out that the area is .
Now, we can add them up! , except this isn’t actually the right answer. Notice that if it was the total distance traveled, then it would indeed be the correct answer because that is how far the car has traveled! The distance does not concern itself with direction. However, we are asked for how far the car has traveled from its starting position. We need to remember that if the rate of change is negative, so is the area!
If we take into account that the second triangle is negative and that the car is moving backwards, then we get units. This is indeed how far the car has traveled from its starting position from the interval !
Integral Notation
Because this is math, the integral has a notation to it. Are you ready? Here we go!
and are the bounds, and is the function we will be integrating.
If we want to represent the area under our first graph, then we can write the integral as such:
Let’s dissect what this means. Notice that the area on the graph goes from the interval , and it's put on the integral as such! On the bottom is , and on the top is , just like the interval! This is what we call the bounds of an integral.
Now, for the part. If the graph in the picture were to be , then the area we are talking about involves being under , the curve! The part is something in the future that we will address soon. Not in this article though, just know it exists! We’re still on the first article of integrals, we gotta hold ourselves back a little.
Example 2:
A person is walking outside taking a stroll along a road. The person’s speed can be modeled by the function in miles per hour where the function is shown below. If the runner starts at his house at and stops walking at , then approximately how far is the person from his house in miles? Represent the problem with an integral and approximate the value of the integral using geometry.
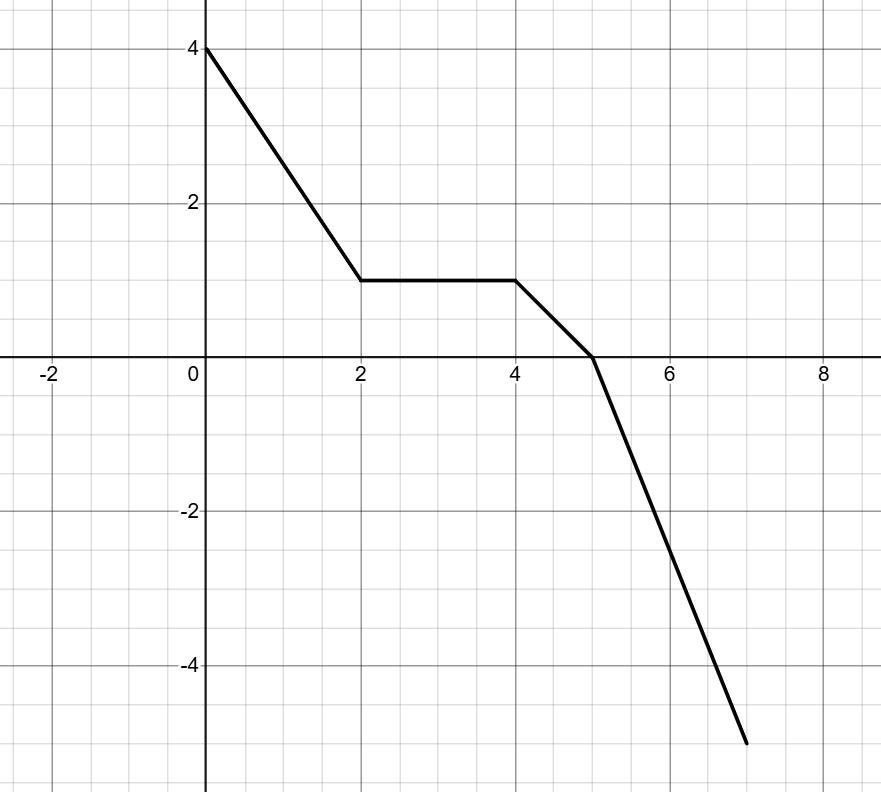
There is a lot to unpack here, so let’s begin by understanding the situation. The person is currently walking, and his velocity is in miles per hour and is represented by the function on the graph. In the function, he moves forwards for the first 5ish hours and then turns back until 7 hours have passed. How do we represent all of this with an integral?
Remember that the components of an integral are the interval and the function. We have the interval which is as stated in the problem and shown on the graph, and the function is as said in the problem. Using this information, our integral is:
Don’t worry too much about the , as we will cover that in future topics not too far from now. But anyways, we have figured out the integral that represents the area under the curve! Now, we can approximate the area using a few triangles and rectangles as shown below!
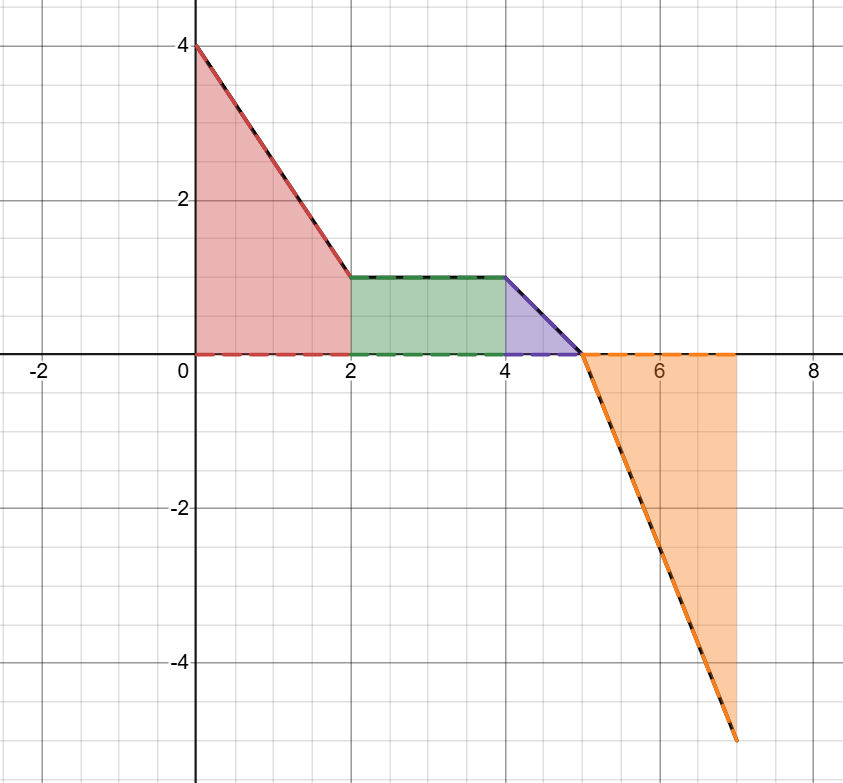
Using geometric approximation can be very useful for finding the area under the curve, and we will eventually learn how to actually solve these problems numerically!
The triangles and rectangles from the interval all added up are equal to , and the triangles and rectangles from the interval all added up are equal to ! Make sure you don’t make the mistake of thinking that the answer is . Remember that the area under the curve of the negative part is negative, so we have instead.
One thing that we must concern ourselves with are units. We have completely ignored them for the entire question! Understand that the value of the function is in miles per hour, and that the time is in hours. If we were to use the equation , then our units would be . Our units are very important, and it isn’t enough to say that the answer is in a word problem.
The answer is miles from the house.