Introduction
You may have noticed while looking at the periodic table that even though one mole of amu is equal to one gram, the molar masses of elements are not whole numbers. This is because, in nature, most elements are not found in only one form, but instead have isotopes with different masses. This topic explains this effect and how mass spectrometry can be used to calculate molar masses.
Mass Spectrometry
In order to find the average atomic mass of an element, and thus is molar mass, we need a way to find out how much of each isotope is the sample (atomic structure is covered more in depth in topic 1.5, but for now you just understand that they are the same element with a different atomic mass). This is where mass spectrometry comes in. Mass spectrometry is a technique that separates isotopes based on their mass to charge ratio, often notated as . The reason that the mass to charge ratio can be used to find isotopes is because the charge doesn’t change, which lets us measure the atomic mass of the isotopes. Overall, mass spectrometry graphs will either be relative abundance (in ) over or relative abundance over amu.
Calculating with Mass Spectrometry Graphs
It’s very important to be able to calculate the average atomic mass using a mass spectrometry graph (or tell the relative abundance of isotopes).
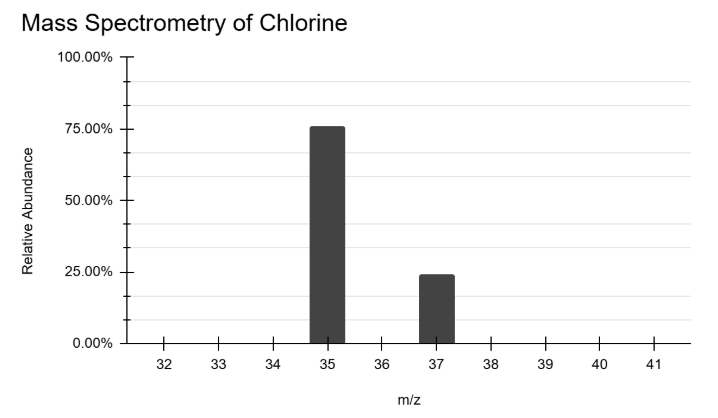
Here is a mass spectrometry graph of the element chlorine. We can see there are two isotopes, and . Furthermore, the isotope has a much higher abundance than isotope. From this, we can estimate the average atomic mass to be somewhere in between 35 and 36 amu. To get even more specific, if we look at the relative abundance of each, we can say has about abundance, and has about abundance. We can perform the calculation to get a much better estimate of average amu for Chlorine.
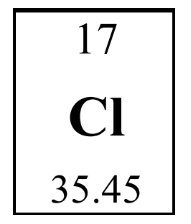
We can see that this was a pretty close estimate. If we were given the exact relative abundances of the isotopes, we could perform the same calculation to a much higher accuracy.
Finding Elements with Mass Spectrometry Graphs
One of the more common things you’ll be asked to do with a mass spectrometry graph on the AP exam is to find the element that the graph is representing.
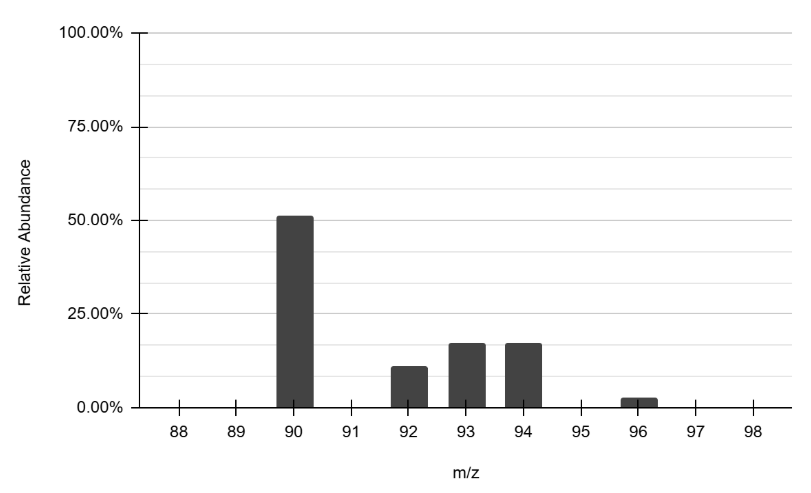
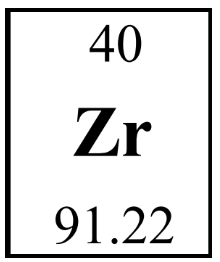
We can see the highest peak is on an isotope with , with several other isotopes with higher atomic masses. We can make a good estimate that the average atomic mass will be higher than , but not too much higher, likely in the range of .
When we look at the periodic table, we see that the only element in this range is zirconium (), making it the answer to this problem.