
Introduction
Welcome back to AP Precalculus! Today we will be talking about Exponential Function Context and Data Modeling! With no further ado, let’s get started!
Modeling Data with Math
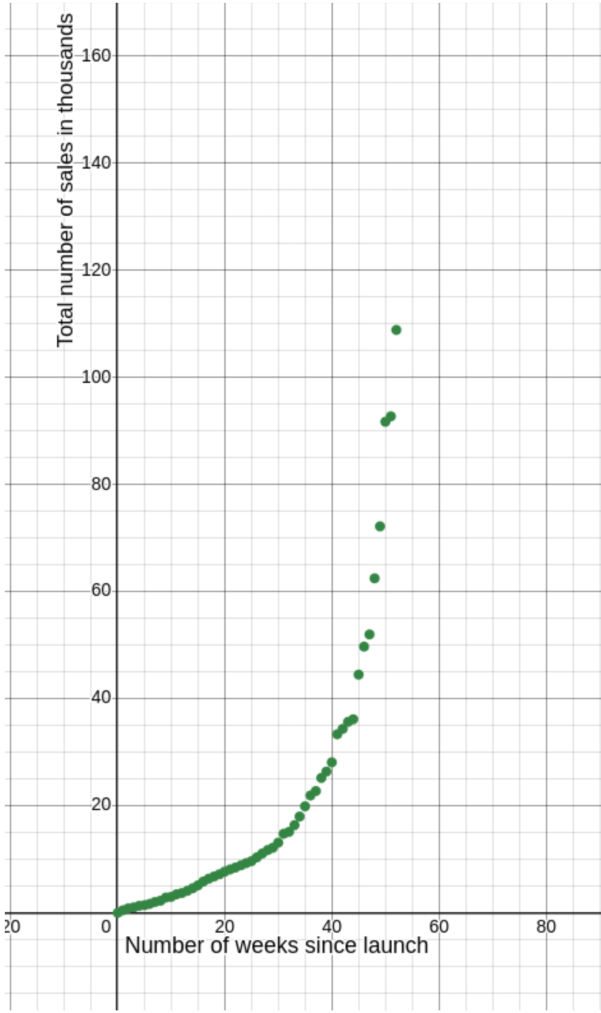
Let’s dive into the following scenario: A company is trying to track the total number of sales a product made over the first year that it was released. To visualize this data, the company took a snapshot of the total number of sales each week and graphed it in a chart, which is shown below.
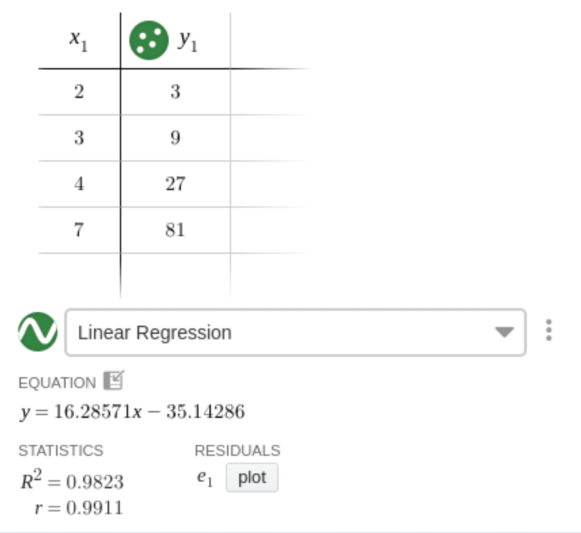
Now the company wants to predict how many total sales they will have by the end of the next year. The issue is that, at the moment, all we have is data, and while data on its own is nice, it doesn’t tell us much besides the general trends on what is happening. This is where regressions come in. Regressions allow us to take a dataset, such as the one shown below, and try to fit a function to the data by changing the constants of the data. For example, if I were to use an exponential regression on the dataset, the calculator will try to find values of and that make the function most closely fits the data. In this case, the optimal values of and were and respectively. Below is the graph of the function .
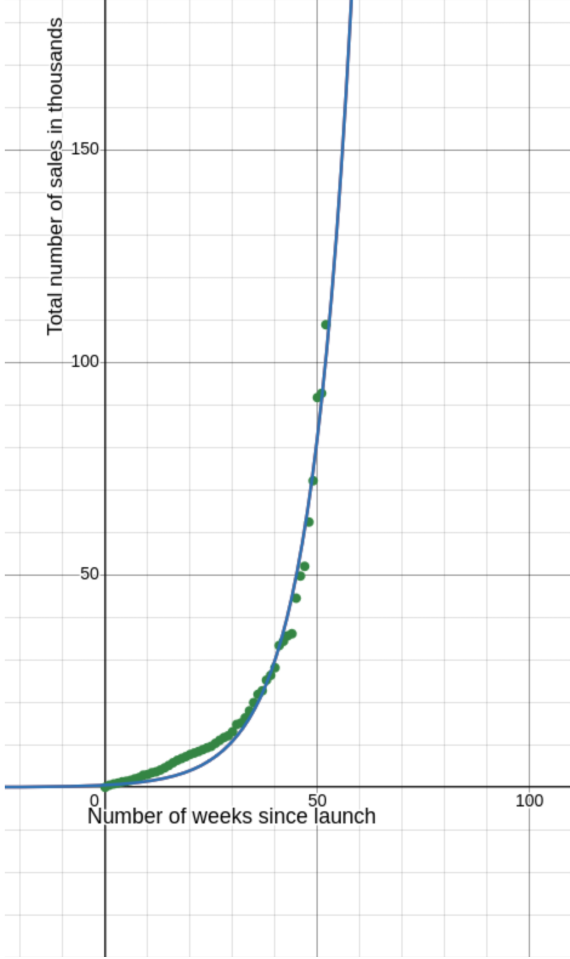
The regression above is an exponential regression, since it attempts to fit the data to an exponential function. There are many different types of regressions you can use, such as a linear regression (which tries to match the function to a linear equation).
Calculating a regression
The below guide will be using Desmos, as you are given access to it on the Bluebook application. [Editor's Note: More details about Desmos Calculator Usage can be found in Exam Guides section of AP Precalculus]. Please refer to your specific calculator’s manual for advice regarding your calculator
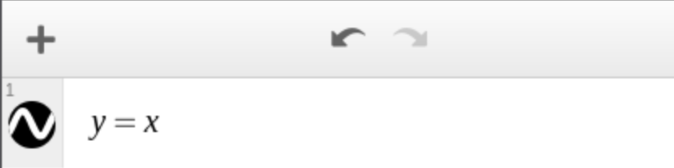
1) Click on the + icon above the equations

2) Click on the table
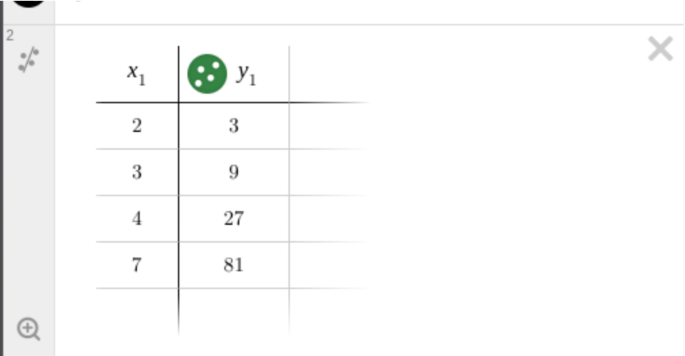
3) Fill in the data into the table
Click this icon next to the the table and select your desired regression type.

Modeling Data without a calculator
The AP exam is divided into two parts, one where you are allowed to use your calculator, and one where you aren’t. Using a regression tool on your calculator works for the calculator-allowed section of the test, but is not possible on the calculator-disallowed section of the test. The methods used to solve these problems have been mostly discussed in previous topics, so you should already be familiar with how to solve these. Below are a couple of question formats you might be given on a quiz or the AP exam along with how to solve them.
-
You are provided a dataset of values. Would a linear regression or exponential regression fit the data better?
- For a couple pairs of data points, use both the linear average rate of change formula () and the formula for the growth/decay factor () and see which one is constant / varies the least. Since it is very difficult to calculate the roots by hand, it is much more feasible to only test the linear average rate of change formula and see if it fits.
- You can also look at the data points and try to see if the rate of change is (close to) linear, though this isn’t as foolproof.
-
You are given a graph of values. Would a linear regression or exponential regression fit the data better?
- Simply look at the graph, if the points form a straight line (or close to it), it’s most likely linear. Otherwise, it’s most likely exponential.
-
You are given two points on a function of the form . Find and .
- You can solve for by using the formula for the growth/decay factor. After that, you can solve for by choosing one of the points, plugging in and , and solving for .
-
As increases by units, increases by a ratio of . The initial value of the function is . Find a function that is the same as the expression above.
- We know the ratio = , and the initial value is equal to , so we already have and in our function. That means we just need to account for the first clause in the statement. To account for that, we need to replace with ; if increases by , then the value of the exponent will increase by , meaning the / the output will be multiplied by $r$. Therefore, our final function is .
e
is a constant that is approximately equal to , and appears frequently in problems involving real-life scenarios. You do not need to know any more about it for this course, but this section is too short, so here’s a fun fact about : If you draw a line on the graph of such that the line only intersects once (assuming the line were to extend forever), then the slope of the line is the same as the value of at the -value where the line and function intersect!