
Introduction
Welcome back to AP Precalculus! Today’s topic will be similar to the one from the previous topic, and will go into finding the best model for a function. Without further ado, let’s get started.
Residuals
Let’s go back to the graph from the previous topic, which shows both data-points and the exponential regression for those data points.
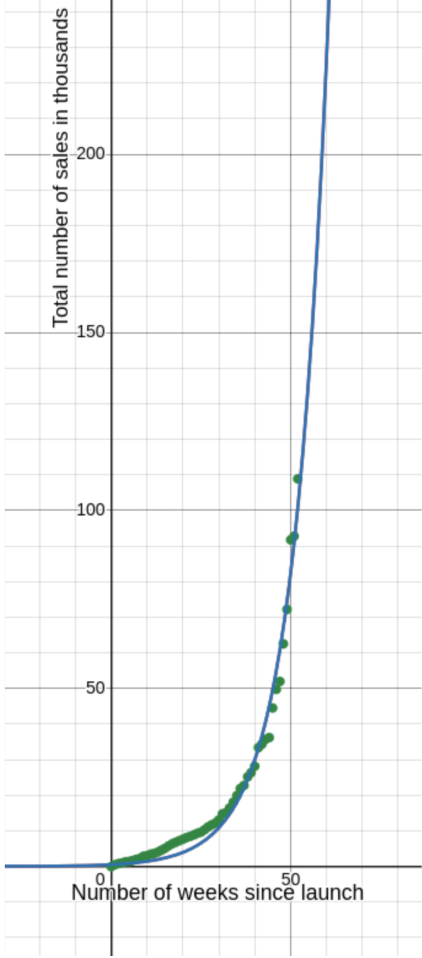
You might notice that none of the datapoints are on the graph of the function. As discussed in the previous topic, a regression is not a perfect mapping of the data to a function, but rather a function meant to approximate the data. This is especially noticeable at the lower -values, where the regression function undershoots the datapoints by a considerable degree.
In order to further examine the error in the function, we can find the residuals of the regression. The residuals of a regression is the difference between the data point and the function modeling it. The residual plot is obtained by plotting the residuals on a graph. Below is the residual plot of the graph above.
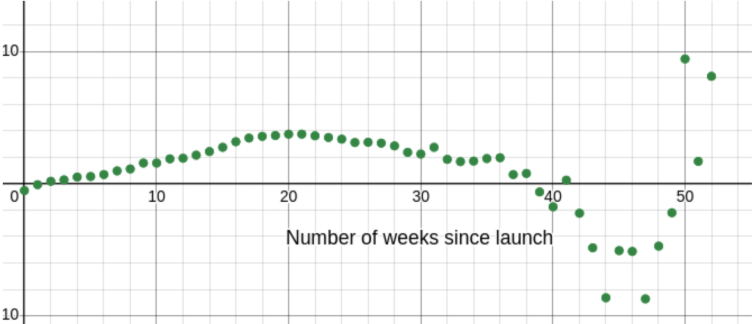
Looking at this plot, we can see that the residuals follow a somewhat smooth curve at the beginning, but then go all over the place near the end. The points at the beginning are above the line, which reflects our earlier statement that the data points at the beginning are above the graph of the function. When a residual is greater than , we say that the function underestimates the function at that point. When a residual is less than , we say that the function overestimates the function at that point.
If you look at this graph, while the points initially show a slight pattern, the points are generally scattered about near the end, so we would say that the residuals of this graph do not have a pattern. However, take a look at this residual plot.
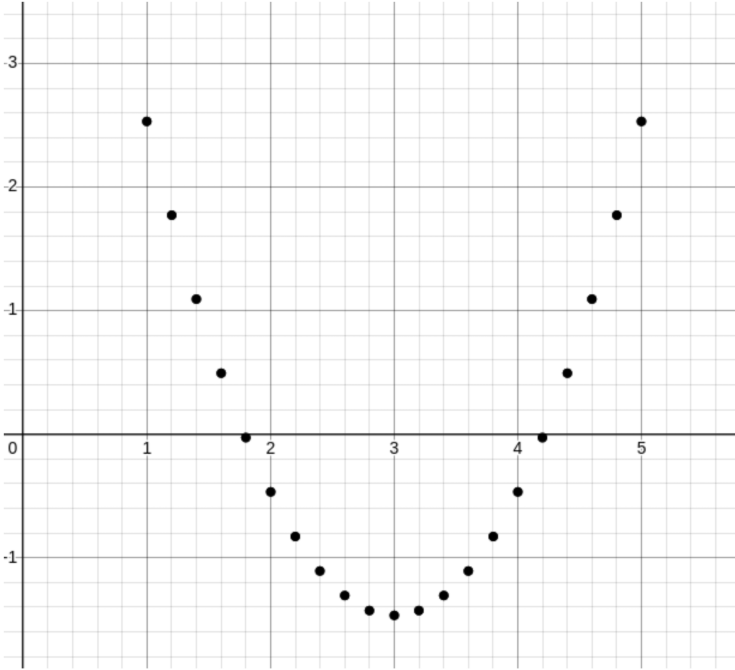
This is the residual plot of the linear regression of the function . Unlike the plot we saw before, the residual plot follows a clear pattern.
Whether the residual plot follows a clear pattern determines whether the model (or regression type) is appropriate. In the first example, the residual plot didn’t show a clear pattern, and so the model is appropriate for the function. On the other hand, in the second example, the residual plot shows a clear pattern, meaning the model is not appropriate for the data.
As a quick side note, the AP exam will often be very obvious about what is a clear pattern or not when they give you a residual graph, since all CollegeBoard is testing you on is if you know how to figure out if a model is appropriate for the data.
Finding an appropriate model
We previously discussed some basic descriptions on if a model is appropriate in the previous topic, and CollegeBoard expects you to know how to figure out whether a linear, quadratic, or exponential model works best. A couple of tips on this section
- If you’re given a graph and asked to find the most appropriate model for the graph, try to trace the points that you are given and see if they closely align with a linear, quadratic, or exponential function.
-
If you’re given a set of data points in a table and asked to find the most appropriate model:
-
If the function increases and then decreases (or decreases and then increases), it’s likely quadratic.
- Quadratic functions have a single turning point (a maximum or minimum), which causes this change in direction. When the input values are evenly spaced, this behavior can also be identified by finding the differences between consecutive outputs. If the differences are not constant, but the differences of those differences are approximately constant, a quadratic model is appropriate.
- If applying the average rate of change formula on random pairs of points results in a relatively constant value, it’s likely linear
-
Otherwise, it’s likely exponential
- Exponential behavior is characterized by approximately constant ratios between consecutive outputs.
- Sometimes (perhaps on your own school-based tests) a quadratic model may resemble an exponential or vice versa. CollegeBoard will typically provide data where the appropriate model is fairly clear.
-
If the function increases and then decreases (or decreases and then increases), it’s likely quadratic.