A periodic function is a function whose values repeat at regular intervals.
Examples include tides, daylight hours, Ferris wheel height, and the position of a rotating object.
The period is the smallest positive horizontal distance over which the function repeats.
If f(x+P)=f(x), then P is a period of the function.
The frequency describes how many complete cycles occur over a given interval.
For sinusoidal functions, the period and frequency are related by frequency=period1.
When modeling periodic data, identify:
The maximum and minimum values
The midline
The period
Where a cycle begins
Whether the function initially increases or decreases
A sinusoidal model can generally be written as f(x)=Asin(B(x−C))+D or f(x)=Acos(B(x−C))+D.
Topic 3.2: Sine, Cosine, and Tangent
The trigonometric functions can be defined using the unit circle, which has radius 1 and center (0,0).
If a point on the unit circle corresponds to an angle θ, its coordinates are (cosθ,sinθ).
Therefore, cosθ=x and sinθ=y.
Tangent is defined by tanθ=cosθsinθ for all cosθ=0.
An angle measured counterclockwise from the positive x-axis is positive.
An angle measured clockwise is negative.
One full revolution is 360°=2πradians.
To convert degrees to radians: θrad=θdeg180π.
To convert radians to degrees: θdeg=θradπ180.
The signs of sinθ and cosθ depend on the quadrant.
QuadrantIIIIIIIVsin++−−cos+−−+tan+−+−
A useful way to remember this is with the mnemonic All Students Take Calculus:
Quadrant I: All positive
Quadrant II: Sine positive
Quadrant III: Tangent positive
Quadrant IV: Cosine positive
The sine of an angle in standard position is the ratio of the vertical displacement of point P from the x-axis to the distance from the origin to P, which equals the y-coordinate of P on the unit circle.
Topic 3.3: Sine and Cosine Function Values
The most important values come from the special angles 0,6π,4π,3π,2π.
The values in the other quadrants can be found using the reference angle and the appropriate sign.
A reference angle is the positive acute angle between the terminal side of an angle and the x-axis.
For example: sin(65π)=21 because the reference angle is 6π and sine is positive in Quadrant II.
Given an angle θ in a circle with radius r, the coordinates of the point where the terminal ray intersects the circle are (rcosθ,rsinθ).
Two important identities are:
sin(−θ)=−sinθ
cos(−θ)=cosθ
Therefore, sine is an odd function, and cosine is an even function.
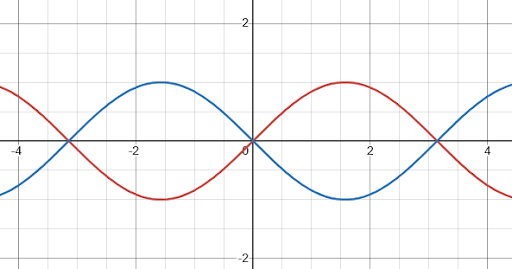
Figure 3.16.1: Red: f(x)=sin
ϴ
, Blue: f(-x)=-sin
ϴ
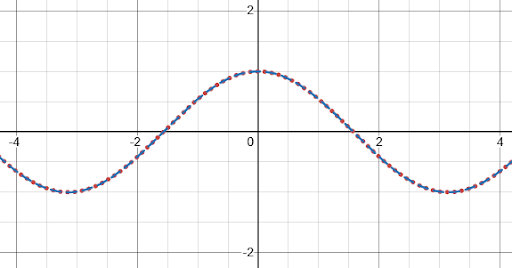
. Made using Desmos.Figure 3.16.2: Red: f(x)=cos
ϴ
, Blue: f(-x)=cos
ϴ
. Made using
Desmos.
Topic 3.4: Sine and Cosine Function Graphs
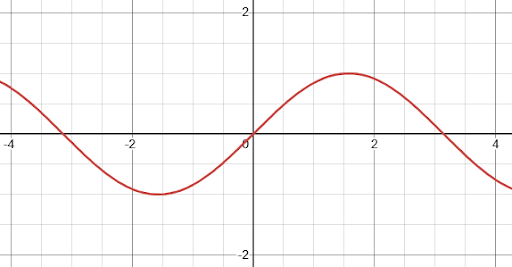
The parent sine function is f(x)=sinx.
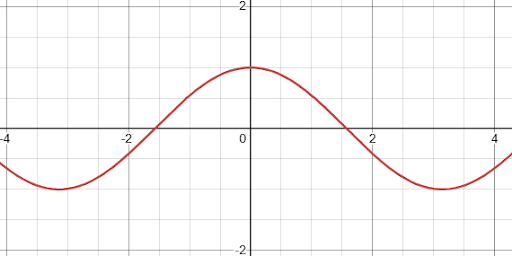
The parent cosine function is f(x)=cosx.
Both have:
Domain: (−∞,∞)
Range: [−1,1]
Period: 2π
Amplitude: 1
The sin graph begins at the midline: sin(0)=0.
The cosine graph begins at its maximum: cos(0)=1.
Important points for sine over one period:
xsinx002π1π023π−12π0
Important points for cosine over one period:
xcosx012π0π−123π02π1
Sine and cosine are both periodic: f(x+2π)=f(x).
“Periodic” refers to how the function repeats over a certain period (2π in this case).
Figure 3.16.3: f(x)=sin(x). Made using
Desmos.Figure 3.16.4: f(x)=cos(x). Made using
Desmos.
Topic 3.5: Sinusoidal Functions
The sine and cosine functions are both sinusoidal functions. They are related by a phase shift: cosx=sin(x+2π)
The period of the parent function f(x)=sinx and g(x)=cosx is 2π. Their frequency is the reciprocal of their period: Frequency=2π1.
The amplitude is half the difference between the maximum and minimum values: Amplitude=2maximum−minimum. The amplitude of both y=sinx and y=cosx is 1.
The midline of both parent functions is y=0.
As input values increase, sinusoidal functions oscillate between concave down and concave up.
The graph of y=sinx has rotational symmetry about the origin, making sine an odd function (see figure 3.16.1).
The graph of y=cosx has reflectional symmetry across the y-axis, making cosine an even function (see figure 3.16.2).
Topic 3.6: Sinusoidal Function Transformations
A general sinusoidal function can be written as f(x)=Asin(B(x−C))+D or f(x)=Acos(B(x−C))+D, where A,B,C,D∈R, where A,B=0.
Amplitude: ∣A∣ determines the amplitude.
Amplitude=∣A∣
Vertical shift and midline: D determines the vertical shift and midline.
Midline:y=D
Maximum and minimum: The highest and lowest points on the graph, respectively.
Maximum=D+∣A∣
Minimum=D−∣A∣
Period: B determines the period.
P=∣B∣2π
∣B∣=P2π
Phase shift: C determines the horizontal translation. In the form Asin(B(x−C))+D, the phase shift is C units horizontally.
Be careful with expressions such as sin(2x−π). Factor out 2 first:
sin(2x−π)=sin(2(x−2π))
Therefore, the phase shift is 2π units to the right.
Reflection: If A<0, the graph is reflected across its midline. A negative B reverses the horizontal orientation, although the period still uses ∣B∣.
Horizontal dilation: The transformation g(x)=sin(Bx) changes the period by a factor of ∣B∣1.
Vertical dilation: The transformation g(x)=Asinx changes the amplitude by a factor of ∣A∣.
Combined transformations: For y=Asin(B(x−C))+D, the amplitude is ∣A∣, the period is ∣B∣2π, the midline is y=D, and the phase shift is C. The same results apply to cosine functions
Finding a sinusoidal equation from a graph:
Find the maximum and minimum values.
Calculate the amplitude.
Calculate the midline.
Determine the period P.
Calculate B=P2π
Determine the phase shift and choose sine or cosine based on the graph’s starting position and shape.
Substitute the values into the general equation and verify that it matches the graph.
Topic 3.7: Sinusoidal Function Context and Data Modeling
Periodic data follows a repeating pattern, such as tides, seasonal temperatures, daylight hours, or the height of a rotating object. A sinusoidal model approximates this repeating behavior.
The period P represents the length of one complete cycle. To estimate it from a graph or data set, find the horizontal distance between consecutive peaks or consecutive troughs: P=tpeak 2−tpeak 1.
The amplitude measures how far the output typically varies from its central value. If a tide reaches a maximum height of 14ft and a minimum height of 2ft, then A=214−2=6ft.
The midline is 8ft, representing the center of the tide’s vertical oscillation.
A sinusoidal model can be built by identifying key features of the data. The maximum and minimum help determine the amplitude and midline, while the period determines how quickly the cycle repeats. The phase shift aligns the model with the timing of the observed data.
The choice between sine and cosine depends on the starting point of the data. Cosine is convenient when the cycle begins at a maximum or minimum, while sine is convenient when it begins at a midline crossing.
A sinusoidal regression uses technology to find a sinusoidal function that fits a data set. Unlike a model constructed from a few selected points, regression uses multiple observations to find a curve that approximates the overall pattern.
A model can estimate outputs at a specified input or help determine when a particular output occurs. For example, a tide model can estimate the water height at a given time or approximate when the tide will reach 10ft.
Models should be evaluated within the context of the situation. A seasonal temperature model may be reasonable for future dates near the observed data, but extrapolating far beyond the data can produce unreliable predictions. Real-world patterns may change over time or deviate from a perfect sinusoid.
When interpreting a model, check the units of both variables, whether the input is measured in degrees or radians when applicable, and whether the predicted values are reasonable for the situation.
Topic 3.8: The Tangent Function
Tangent is defined as tanx=cosxsinx
Therefore, tangent is undefined whenever cosx=0
This occurs at x=2π+kπ,k∈Z
These values create vertical asymptotes.
The tangent of an angle θ represents the slope of the terminal ray when the angle is in standard position and its vertex is at the origin: tanθ=xy=cosθsinθ,cosθ=0.
On the unit circle, the terminal ray passes through P=(cosθ,sinθ), so tangent measures the ray’s rise divided by its run. When x=0, the ray is vertical and the tangent is undefined.
The parent tangent function is f(x)=tanx.
Domain: All real numbers excluding all x=2π+kπ.
Range: (−∞,∞).
Period: π.
Midline: y=0.
Tangent has zeros at x=kπ,k∈Z.
A transformed tangent function can be written as f(x)=Atan(B(x−C))+D.
The period of tangent is P=∣B∣π.
Unlike sine and cosine, tangent has no amplitude because its range is unbounded.
Topic 3.9: Inverse Trigonometric Functions
Inverse trigonometric functions undo trigonometric functions: y=sin−1(x) means siny=x.
The three major inverse functions are arcsinx,arccosx,arctanx.
They are also commonly represented as sin−1x,cos−1x, and tan−1x, respectively.
They are not reciprocals: sin−1(x)=sinx1.
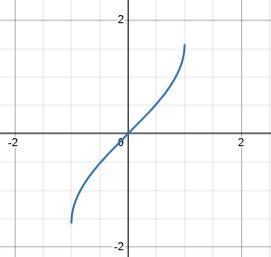
Trigonometric functions must be restricted to particular intervals to have inverses:
The graphs of secant and cosecant have branches that correspond to the positive and negative portions of cosine and sine, respectively.
Secant and cosecant have ranges (−∞,−1]∪[1,∞).
Topic 3.12: Equivalent Representations of Trigonometric Functions
A trigonometric identity is an equation that is true for every value for which both sides are defined.
The three main reciprocal identities are:
cscx=sinx1
secx=cosx1
cotx=tanx1
The two quotient identities are:
tanx=cosxsinx
cotx=sinxcosx
The Pythagorean identities are:
sin2x+cos2x=1
1+tan2x=sec2x
1+cot2x=csc2x
The sum identity for sine is sin(α+β)=sinαcosβ+cosαsinβ.
The sum identity for cosine is cos(α+β)=cosαcosβ−sinαsinβ.
When α=β, the double angle identities are produced:
sin(2x)=2sin(x)cos(x)
cos(2x)=cos2(x)−sin2(x)
cos(2x)=1−2sin2(x)
cos(2x)=2cos2(x)−1
Equivalent trigonometric forms may be useful in solving trigonometric equations and inequalities.
Topic 3.13: Trigonometry and Polar Coordinates
A point in rectangular coordinates is represented by (x,y).
A point in polar coordinates is represented by (r,θ).
r is the distance from the origin.
θ is the angle measured from the positive x-axis.
The conversion equations are:
x=rcosθ
y=rsinθ
To convert from rectangular to polar:
r=x2+y2
tanθ=xy, with the quadrant used to determine the correct θ.
A polar coordinate does not have a unique representation.
For example, (r,θ) and (r,θ+2π) represent the same point.
Negative r values are allowed: (−r,θ)=(r,θ+π).
Therefore, the same point can have infinitely many polar representations.
A complex number can be represented in the complex plane using either rectangular coordinates (a,b) or polar coordinates (r,θ).
In rectangular form, the complex number is written as z=a+bi, where a is the real part and b is the imaginary part.
In polar form, it is written as z=rcosθ+risinθ, or equivalently z=r(cosθ+isinθ), where r is the distance from the origin and θ is the angle measured from the positive real axis.
Topic 3.14: Polar Function Graphs
A polar function has the form r=f(θ).
Instead of assigning y to each x, the function assigns a distance r to each angle θ.
To graph a polar functions:
Choose values of θ.
Calculate r.
Plot (r,θ).
Connect the points as θ changes.
Important polar curves include circles, roses, limaçons, and lemniscates.
Circles
A polar circle centered at the origin is r=a.
A circle of radius a centered at the origin can also be represented using a constant radius.
Rose Curves
Rose curves commonly have the form r=acos(nθ) or r=asin(nθ).
If n is odd, the rose has n petals.
If n is even, the rose has 2n petals.
The maximum distance from the origin is generally ∣a∣.
Limaçons
Limaçons commonly have the form r=a+bcosθ or r=a+bsinθ.
Their shape depends on the relationship between a and b.
They can have an inner loop, a dimple, or no inner loop.
Lemniscates
A common form is r2=a2cos(2θ) or r2=a2sin(2θ).
They produce a figure-eight-shaped curve.
Symmetry can make polar graphs much easier to analyze.
For example:
If f(−θ)=f(θ), the graph has symmetry about the polar axis.
If f(π−θ)=f(θ), the graph has symmetry about the vertical axis.
If f(θ+π)=f(θ), the graph has symmetry about the origin.
Topic 3.15: Rates of Change in Polar Functions
The average rate of change of r with respect to θ over an interval is θ2−θ1r2−r1.
This describes how much the radius changes, on average, for each unit increase in the angle.
A positive average rate of change means that r increases as θ increases over the interval.
A negative average rate of change means that r decreases as θ increases over the interval.
An average rate of change of 0 means that the radius has the same value at the two endpoints: r1=r2.
This does not necessarily mean that r stayed constant throughout the entire interval.
The rate of change can also be estimated from a table or graph by calculating ΔθΔr.
When comparing intervals, a larger positive value means r is increasing more rapidly, while a more negative value means r is decreasing more rapidly.
If the average rate of change becomes increasingly positive over equal-sized intervals, the radius is increasing at an increasing rate.
If the average rate of change becomes less positive over equal-sized intervals, the radius is increasing at a decreasing rate.
Increasingly negative rates indicate that the radius is decreasing more rapidly, while rates becoming closer to 0 indicate that the radius is decreasing more slowly.
Be careful not to confuse ΔθΔr with the slope of the polar curve in the xy-plane. The former describes how the radius changes as the angle changes.
For a polar function r=f(θ), relative extrema occur when the radial distance r changes from increasing to decreasing or vice versa.
A relative maximum corresponds to a point farthest from the origin.
A relative minimum corresponds to a point closest to the origin.
These extrema describe the distance from the origin, and is not necessarily the highest or lowest point on a graph.