
For both the MCQ and FRQ sections. We will cover Units 1, 2, and 3. Unit 4 is not assessed on the exam, so it is not included.
How to Use This Guide
This is a review guide. That is, this guide will be of little to no use if you have not learned the content. It mainly serves to provide examples that can be used as a sort of “stem” for responses during the AP exam.
Note: This guide uses integer examples to explain concepts; however, these are simply examples, not the actual formula you would have to input. Please use these examples to learn how to apply concepts, not to copy them verbatim during the exam.
On the free-response section (FRQ), your answer could be 100% mathematically correct, yet still earn zero points for that part because the way the answer was presented was vague or not specific enough. In the multiple-choice section (MCQ), it is common to have multiple answer choices point to the same numerical answer, but each may have a distinct rationale for that answer. Occasionally, there may not even be a numerical answer. It is important to be able to determine which description is correct, and apply it during the exam.
Part 1: General Exam Knowledge and Advice
The exam is 2 hours and 55 minutes long.
Section I is Multiple Choice
42 questions, 1 hour 45 minutes, 62.5% of score
- Part A: 29 questions, 65 minutes, no calculator. Worth 43.75% of the exam.
- Part B: 13 questions, 40 minutes, graphing calculator required. Worth 18.75% of the exam.
Section II is Free Response
4 questions, 1 hour 10 minutes, 37.5% of score
-
Part A: 2 questions, 35 minutes, graphing calculator required. Worth 18.75%.
- Question 1: Function Concepts
- Question 2: Modeling a Non-Periodic Context
-
Part B: 2 questions, 35 minutes, no calculator. Worth 18.75%.
- Question 3: Modeling a Periodic Context
- Question 4: Symbolic Manipulations
Each FRQ is worth 6 points, so the entire FRQ section is 24 points.
The exam is a hybrid digital exam: the questions will appear in Bluebook, but students will write their answers (for the FRQ section) in a paper booklet.
You may use a pencil OR a (black or dark blue) pen on the FRQ section. It is a myth that only a pen can be used. If a pencil is used, simply make sure that all your writing is clear, legible, and darkly marked enough so that it can be scanned.
Task Verbs
Nearly every AP exam has “types” of questions. For the AP Precalculus exam, at the very least, the prompts will tell you exactly how each question should be answered. A list of task verbs is shown below:
Universal Justification Format
Every justification on the AP Precalculus exam can be answered with the same C.E.R. format that’s so commonly used in other classes.
- Claim: state the conclusion. ("The function does not have an inverse.")
- Evidence: bring up specific values, intervals, or a feature of the graph.
- Reasoning: Connect the evidence to the definition or property that supports the claim. ("because there are multiple inputs (list each input) that correspond to one output (state the output)")
Be Specific
After writing a justification, ask yourself if your response uniquely answers the problem given. This piece of advice is more to be safe.
- "The function is not one-to-one." (True of infinitely many functions. It is not specific to the problem at hand)
- "It fails the horizontal line test." (Specify “it.” Also, this is NEVER a valid justification, as you will read about later in this guide)
- "Because , two different inputs correspond to the same output, so does not have an inverse function."
The third response names specific numbers and functions from the actual problem. On the AP exam, you would change it based on YOUR problem.
Remember, this is mainly out of good practice. However, based on the context of the problem, it is possible to get points as long as your answer is clear enough.
Standard rules
- Decimals: three places. Unless the problem says otherwise, any decimal approximation must be accurate to at least three places after the decimal point. You may round or truncate. Trailing zeros are optional, so and are both fine.
- Do not round in the middle. Store intermediate numbers/calculations in your calculator and round at the very end. Rounding early may produce an answer that is off.
- Show the setup. For example, if you are finding the Average Rate of Change, write .
- Units and context. Any "interpret" answer needs units and a sentence that connects the number to the context.
- Every part is graded independently. If you get part (a) wrong, you can still earn full credit in part (b) by using your own (wrong) answer consistently.
Part 2: Common Justifications
Rate of Change and the Four Model Families
Rate of change is arguably one of the most tested concepts in AP Precalculus. Specifically, when deciding which function best models the data, knowing how to calculate the average rate of change (and its average rate of change) is essential. Typically, you are given a table and asked which kind of function fits.
However, before you begin calculating anything, it is important to ensure that your inputs are over consecutive, equal-length, input-value intervals. The reason that phrase matters is because the reasoning that "the outputs go up by 3 each time" is meaningless unless the inputs are spaced evenly. Comparing outputs at is a correct comparison, but comparing outputs at is not.
Sentence stems
- Linear: "Over consecutive equal-length input-value intervals, the output values change by a constant , so a linear model is appropriate."
- Quadratic: "Over consecutive equal-length input-value intervals, the second differences of the outputs are a constant , so a quadratic model is appropriate."
- Exponential: "Over consecutive equal-length input-value intervals, the output values change proportionally by a constant factor of , so an exponential model is appropriate."
- Logarithmic: "Over equal-length output-value intervals the input values are proportional, so a logarithmic model is appropriate."
When answering these questions on FRQs, it is imperative that you state the domain in which you are measuring the differences. For example, if you’re finding the constant differences between to , then you must include “over the interval to ” in your response. This is not optional. On the exam, you must include the interval.
Increasing and Decreasing
Occasionally, you will require the formal definition of increasing and decreasing. A function is increasing on an interval, if , then and so on for the entire interval. For decreasing, it is simply the inequality flipped. In layman’s terms, it simply means whether the function values rise or fall as increases.
On another note, it does not matter whether you label an interval where a function is increasing with closed or open brackets/parentheses, provided any included endpoints are in the domain and the function is increasing on the resulting interval. That is, it does not matter whether you say or when trying to provide an answer to the interval over which a function is increasing.
Concavity
Concavity refers to whether the rate of change is increasing or decreasing.
- Concave up means the rate of change is increasing. The graph curves like a cup (concave up like a cup).
- Concave down means the rate of change is decreasing. The graph curves like a frown (Concave down like a frown).
There is a second way to attribute concavity: if the average rate of change over consecutive equal-length input intervals is increasing, the graph is concave up; if it is decreasing, the graph is concave down.
A point of inflection is where concavity switches from concave up to concave down or vice versa. In other words, it is when the rate of change goes from increasing to decreasing (or vice versa)
The four combinations
A function can be increasing or decreasing, and concave up or concave down.
Average Rate of Change and Secant Lines
The average rate of change (AROC) of a function over an interval to is given by . It is the slope of the secant line through the points and .
Estimations with AROC
On rare occasions, you may be asked to find the IROC (instantaneous slope) at a point. In these cases, you must estimate by using the AROC of two nearby points. For example, if they were to ask for the slope at , you could find the AROC of and .
More commonly, you will be asked to use the average rate of change over to estimate a function’s value at some point. You may then be asked whether your estimation is greater or lower than the true value.
- If the graph is concave down (like a frown) between the two secant points, your estimate will be an underestimate
- Observe how in the image below, the secant line is under the function, thus showing that the secant-line estimate will be an underestimate.
Created using desmos.com
- If the graph is concave up (like a cup) between the two secant points, your estimate will be an overestimate
- Observe how in the image below, the secant line is over the function, thus showing that the secant-line estimate will be an overestimate.
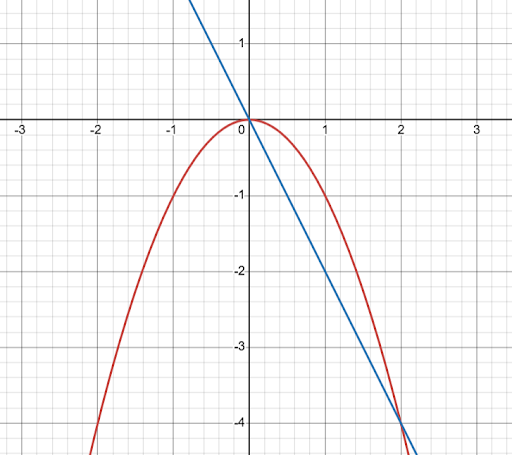
In order to receive the points for correct reasoning, you must
- Make a statement about the concavity OR about whether the ROC (rate of change) is increasing/decreasing
- Explicitly reference the secant line (or the line depicting the AROC)
A response that earns full points could look like this: “Because the graph of is concave down on the interval from to , the secant line through and will lie below the graph of . Thus the estimate using the secant line is an underestimate.”
End Behavior/Limit Notation
The end behavior of a function describes the output values as the input values approach or . There are four conditions that compose proper limit notation:
- The symbol
- The “subscript” or or , where is some real number (for holes and asymptotes)
- The function that you are taking the limit of
- An equal sign and the value it approaches
Put together, it should look something like or .
One Sided Limits
Sometimes, the limiting behavior for a function is different as both sides of the function approach a value differently. In this case, we can use one-sided limits! They are similar to regular limits except they have a small or next to the value the function is approaching, like so:
For , see how there is a small sign? That indicates that the limit is showing the value that is approaching from the right. Similarly, is indicating that the limit is for when the function approaches from the left.
Polynomials/Rational functions
For polynomials, you can determine end behavior just through the leading term. If the lead coefficient is negative, the limit as will equal . If the degree is even, then the function has the same end behavior in the and directions. If the degree is odd, then the function has opposite end behavior in the and directions.
As for rational functions, you must compare the degrees of the numerator to the denominator.
-
If the degree of the denominator is larger,
- The horizontal asymptote of the function will be
- If the degrees are equal, the ratio of the lead coefficients (lead coefficient of numerator divided by lead coefficient of the denominator) is the value approaches as and
-
If the numerator’s degree is one degree larger than the denominator’s, then you will have a slant asymptote, and the end behavior will match the end behavior of the polynomial found by dividing the numerator by the denominator (typically through polynomial long division).
- The same applies for differences greater than one, except that the name is different (for example, for differences of 2, the name is a quadratic polynomial asymptote). However, this won’t come up on the AP Precalculus exam, so it is not necessary to go over.
Zeros and Multiplicity
Say we have a polynomial given by , where , , and are all random distinct integers.
Looking at the graph below, we can see that at and , the graph of will pass through the -axis. However, at will “bounce” off.
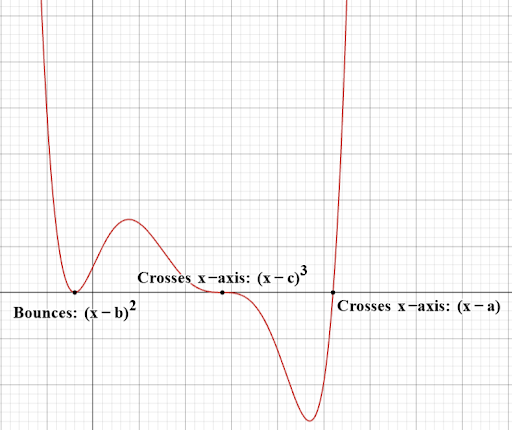
When you have an odd multiplicity, the graph will cross the -axis, and the function will change signs as you pass through that zero.
When you have an even multiplicity, the graph will touch the -axis without crossing, and the function will not change signs as you pass through that zero.
To justify some answer using this, you can simply bring up the multiplicity of zero, state the definition (that if the multiplicity of the zero is ____, the graph will _____ the -axis), then state your conclusion.
Inverse functions
A function has an inverse only if every output correlates to exactly one input. (aka the horizontal line test, however, this is not a valid explanation for the exam).
Remember that when a function has an inverse, the domain and range will be swapped; the domain of will become the range of its inverse, , and the range of will become the domain of . Due to this, a function may not be fully invertible due to it being constrained by domain and range properties.
To justify that a function is not invertible, you must name the specific two inputs that share an output. For example: “Because , the function is not invertible, as there are two input values that produce the same output value. The resulting inverse would no longer qualify as a function.”
To justify that a function is invertible, you can simply state, “The function is invertible because each output is unique to one input.”
Residuals
A residual is the actual value of a function minus the predicted value. A residual graph shows the relationship between that difference and the input. If
- There is no visible pattern (the points are scattered randomly; it will be obvious), then the model is appropriate for the data
- There is a clear pattern (a line, a curve, or a parabola, etc.) then it means the model is not appropriate for the data.
Examples of proper responses could be: “The residual plot appears randomly distributed and there is no clear pattern. Thus, an exponential model is appropriate for the data.” “The residual plot depicts a clear parabolic pattern, so a linear model is not appropriate.”
MCQ
When the MCQ is clearly asking for reasoning or some sort of explanation (rather than a numerical answer), you should try to predict the answer before you read the answer choices.
Identify the Model from a Table
Compute the differences. If it is constant, then it's linear. If the second differences are constant, it is quadratic. Third, cubic; fourth, quartic, etc. (you usually won't get that far). If the differences didn’t work, check if the ratios are constant; if they are, then it should be an exponential. Remember that for this to work your inputs have to be equally spaced apart.
Concavity/AROC from a Graph/Table
Finding the AROC from a table is self-explanatory. You would take the change in -values and divide them by the change in -values (like how you would take a slope from a table). However, for concavity with equally spaced inputs, you must first find the first differences and check whether they are increasing or decreasing. If they are increasing, then the data must resemble a function that is concave up. If decreasing, then concave down.
Typical Trap Answer Patterns
The typical trap answer deviates from the real answer in a couple of ways:
- Opposite sign
- Right answer but wrong explanation (for problems involving explanation)
- Right structure, but the values are incorrect
- An incomplete answer (not what the question is asking for, but a value within the solving process).
Simply make sure to note these trap justifications/answers.
FRQ
There are four types of FRQs that will show up in a predictable order.
FRQ 1 (Function Concepts)
For more FRQ practice, look at FiveHive FRQ Guides and AP Precalculus Past FRQs -- CollegeBoard
This question permits a calculator and is worth 6 points.
Generally, it will look something like this:
Part A:
Evaluate a composition (for example, at some ) Find input value(s) that yield some output value
Part B:
Solve an equation (can use calculator) State the end behavior (remember to use limit notation)
Part C:
Typically a justification question. It is typically, “does this function have an inverse and why”, or “which type of model best models the data and why.”
Because this is a justification guide, we will only look at part C.
Let's look at the first example
If the function is not invertible, then you would say something like “Because , the function is not invertible, as there are two different input values that correspond to the same output value.” If the function is invertible, then you could say something like “Because is increasing/decreasing over its entire domain, there will only be one input for every output value. Thus, has an inverse function.”
In the second example, you could say, for example, “Because the output values change by a constant factor of over consecutive, equal-length, input-value intervals from to , an exponential model is appropriate.”
FRQ 2 (Modeling a Non-Periodic Context)
This question permits a calculator and is worth 6 points. By far, FRQ 2 is the most unpredictable. It is unlike FRQ 3.
But generally, it will look something like this:
Part A:
Embedded in some story, you are given some data points. You have to set up some equations and solve for unknown constants (or use a regression).
Part B:
i. Compute the AROC between a specific time interval ii. Interpret the solution from the b(i) within the context of the question
Part C:
i. Write an equation that is appropriate for a predicted value given by the question ii. Explain any domain restrictions with your new equation in the problem’s context.
The first justification question is part B(iii). Recall, you must explain the concavity and make an explicit reference to the secant line. Review the “Estimations with AROC” section.
The second justification question is Part C. Limitations of the model basically refer to the fact that at some point, the mathematical model may not make sense in the real world (for example, if volume ever became negative) An example could be, "According to the model, after , the [output variable] becomes negative. Because it is impossible to have a negative amount of [output variable], this is a limitation of the model."
End behavior could be like if a model approaches infinity as the input approaches infinity (or even an asymptote). An example is shown below: "According to the model, as increases forever, [output variable] increases without bound. However, this is not possible in reality, as [output variable] cannot grow indefinitely, and thus is a limitation of the model." However, it could also simply be asking you to justify the meaning of an end behavior. For example, "As approaches infinity, the model predicts that [output variable] will approach [where c is any real number]. That means that over a long period of time, the [dependent variable] will stabilize at " An example of [dependent variable] here could be temperature.
Reasonable domain is similar to the limitations. However, one especially well-known example is a flat paper that has squares cut from its corners, and the question is what the maximum volume of the newly formed box is. In these cases, the length of the square obviously cannot be , nor can it be longer than half the length of the entire box. And of course, it cannot be negative. But a general structure for this type of response could be something like, "A reasonable domain for this model is [where c is a real number]. The domain begins at because [observation/context], and it ends at because [observation/context]."
An important note, though, is that quite often the reasonable domain is simply whatever domain was given in the data. That is, a model is only accurate in the domain of the data. If the data only spans from to , then the model is only accurate to to .
FRQ 3 (Modeling a Periodic Context)
This question does not permit a calculator and is worth 6 points. This is by far the most predictable FRQ. It is always a sinusoidal graph and always asks the same question (you can see that the National Mean is significantly higher in FRQ 3 than 2 or 4).
Part A:
You are given a sinusoidal graph with five labeled points (, , , , and ). You are also given some real-world context that secretly tells you facts about the sinusoidal, which may include the period, a max/min, the amplitude, the midline, etc. You must give possible coordinates for these points
Part B:
You have to write the sinusoid as an equation in the form .
Part C:
You have to answer some questions regarding the function’s behavior (it is typically a multiple choice question where you are instructed to figure out the correct statement according to the given graph.) You have to describe the concavity (if the graph’s AROC is increasing/decreasing) and whether the rate of change is increasing or decreasing. The question may also ask about the sign of the function values. (ex. The graph of is positive/negative). Make sure to clarify what the question is about – the actual graph or the rate of change – because this can alter your answer by quite a bit.
Regarding the behaviors, you must simply state the behavior in question, describe the definition, then explain whether the given sinusoidal function (on that interval) fulfills that definition or not.
FRQ 4 (Symbolic Manipulations)
This question does not permit a calculator and is worth 6 points. This FRQ is for students to demonstrate how well they can manipulate functions to get to a certain answer, and a lot of that is based on algebra. Due to that fact, FRQ #4 does not require any justification, however supporting work is required for all portions.
If you would like a guide on this FRQ, please check the FRQ #4 Guide also on our website.
Practice Section
(Calculator Permitted for All Questions)