
Introduction
FRQ #1 on the AP Precalculus Exam will ask you to work with two functions represented in different ways. For example, one function may be given by a graph while another is given by an equation. You will then be asked to connect those representations through function composition, solving equations, looking at function behavior (limits), and determining whether a function is invertible. FRQ #1 is a calculator FRQ, so it may be helpful to familiarize yourself with Desmos and the Ti-84 Graphing Calculator.
Looking at the Givens
Let’s take a look a FRQ #1 from the 2026 exam.
Here, we’re given a graph of a function over :
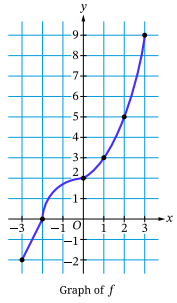
which we are not given an equation for.
We are also given a separate function: .
Part A
i. The function is defined by . Find the value of as a decimal approximation, or indicate that it is not defined. Show the work that leads to your answer.
ii. Find all values of for which , or indicate that there are no such values.
The first thing to do when looking at this FRQ (or really any math FRQ) is to find what the question is specifically asking.
So let’s cut away all the fluff and put this problem in its simplest terms:
i. Find .
ii. Find where .
Now that we have the problem in a more manageable form, it’s time to go and solve it.
For (i), we start by reading the inner value from the graph of at . Looking at the image we were provided, .
Next, we substitute into :
Before writing your answer down, remember that you should always round to 3 decimal places unless the problem says otherwise.
Final Answer:
Note: Your answer MUST include for full points to be awarded. Simply writing is insufficient.
Now it’s time for Part ii. This one is fairly simple. All we’re doing is looking at the graph to see where . We’ll go to and see where it meets the graph of , which is at .
Keep in mind that there may be more than one solution. If you draw a horizontal line at , where is some arbitrary number, and it crosses some function more than once, each interaction is a solution to . Such is the case for 2024’s FRQ #1.
Final Answer:
For more practice on these topics, see Unit 2.7: Composition of Functions.
Part B
Part B will always be a test of your ability to analyze the (typically a logarithmic, exponential, rational, or polynomial function) and use limit notation.
On the 2026 AP Exam, Part B was:
i. Find all values of , as decimal approximations, for which , or indicate that there are no such values.
ii. Determine the behavior of as -values decrease and get arbitrarily close to . Express your answer using the mathematical notation of a limit.
Just like part A, let’s break this one down.
i. Solve .
ii. Find .
i.
All we need to do is set equal to :
Isolate the logarithm by moving everything else over:
Eliminate the logarithm by exponentiating with base :
Check the domain: with this , , which is positive, so is allowed. You can also confirm this with a graphing calculator by graphing and and finding the intersection.
Final Answer:
ii.
There are two ways to get the behavior, and it is worth being able to do both.
Notice that the domain of requires , so . As decreases toward from above, the argument shrinks toward through positive values, and of a positive number approaching decreases without bound.
Alternatively, evaluate at inputs closer and closed to from the right:
The outputs keep dropping, and the graph of has a vertical asymptote at with the curve tending downward beside it.
Final Answer:
For more practice on these topics, see Unit 2.10: Logarithmic Functions.
Part C
This one can get a little tricky. Part C will test your conceptual understanding of the properties of . The College Board rotates between two standard questions:1. Is the function invertible? Give a reason referencing points on the graph.
This is the most common form of Part C, and is what we’ll be looking at in our example.
To answer this, simply state Yes or No for Part i. For Part ii, state whether the function is strictly increasing, strictly decreasing, or strictly monotonic/one-to-one (every horizontal line intersects the graph at most once, and cite at least two or three points from the graph to prove your claim (e.g., ).
2. In this prompt variation, you are given a table of values (at the start of the FRQ). You will then be asked to choose the model that best fits from four choices: Linear, Quadratic, Exponential, Logarithmic. You will be asked to justify your answer. Let’s go over all four cases.
Linear Model
This occurs when the first differences are constant.
A justification may look like this:Over equal-length intervals of input values where , the change in the output values is constant:
Because the average rate of change is constant across all consecutive intervals in the table, a linear function best models .
Quadratic Model
This occurs when the first differences change at a constant rate, meaning the second differences are constant non-zero values.
A justification may look like this:
For consecutive equal-length input intervals with constant , the first differences of the outputs are not constant, but the second differences are constant:
.
Because the rate of change of the rate of change is constant, a quadratic function best models .
Exponential Model
This occurs when consecutive outputs change by a constant proportional factor/ratio (multiplicative pattern) rather than an additive difference.
A justification may look like this:
Over consecutive equal-length intervals where is constant:
, .
Specifically, using values from the table:
Because the outputs grow by a constant multiplicative factor for equal changes in input values, an exponential function best models .
Logarithmic Model
This occurs when input values multiply by a constant factor while output values add a constant difference (or over equal , the rate of change decreases and is inversely proportional to ).
A justification may look like this:
As the input values increase by a constant multiplicative factor , the consecutive changes in the output values are constant. Alternatively, over equal intervals, the function is strictly increasing/decreasing at a decreasing rate with outputs changing additively while inputs grow multiplicatively. Therefore, a logarithmic function best models .
Now that we’ve gone over what to expect, let’s return to our example.
i. Is the function invertible?
ii. Give a reason for your answer in part C (i) based on properties of the function . Refer to points on the graph of in your reasoning.
We can see that has only one -value for every , meaning that it is invertible.
For our justification:
A function is invertible if and only if it is strictly monotonic on its domain, meaning that for all with , it follows that . From the given graph, is strictly increasing across its entire domain , as shown by the ordered pairs: . Because for all in the domain, no horizontal line intersects the graph of at more than one point. Therefore, every output value is paired with a unique input value , which guarantees that an inverse function exists.
Practice FRQ
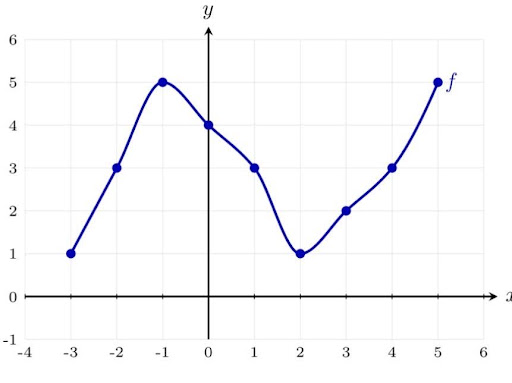
The graph of a function is shown for . An equation for is not given. The function is defined by
A.
(i) The function is defined by . Find the value of as a decimal approximation, or indicate that it is not defined. Show the work that leads to your answer.
(ii) Find all values of for which , or indicate that there are no such values.
B.
(i) Find all values of , as decimal approximations, for which , or indicate that there are no such values.
(ii) Determine the behavior of as -values increase and get arbitrarily close to . Express your answer using the mathematical notation of a limit.
C.
(i) Is the function invertible?
(ii) Give a reason for your answer in part (i) based on properties of the function . Refer to points on the graph of in your reasoning.
SOLUTIONS
Part A
(i) From the graph, the point with is , so . The input is allowed in because . Then
(ii) The horizontal line meets the graph at , , and .
, ,
Part B
(i) Write the equation and solve it:
.
Graphing and and finding the intersection gives the same -value.
(ii) “Increase and get arbitrarily close to ” means approaching from the left. For slightly less than , the numerator is close to (positive), and the denominator is a small negative number, so the quotient is a large negative number. Check the values: , , .
Part C
(i) No.
(ii) The graph contains , , and , so . Different inputs have the same output, so is not one-to-one. The horizontal line crosses the graph three times. The function is not strictly monotonic: it increases on , decreases on , and increases on . Therefore, has no inverse function.