
What’s Up! We’re back with another guide for the Precalculus FRQs! Before we get started, it is important to note that important changes were made in this FRQ to reflect the updated Precalculus Course and Exam Description. Before you use previous year’s FRQs as study materials, please keep that in mind.
So, What is FRQ #2 About?
Essentially, this FRQ is all about analyzing functions in real-word terms. All you have to do is take the real world scenario, and make math equations with it and understand the different parts of the equation. This guide will help you every step of the way! By the way, this FRQ will NOT test on periodic functions, only polynomial, piecewise-defined, exponential, or logarithmic functions will show up. You can use a graphing calculator for this FRQ.
PART A - Constants Deriving:
Let's take a look at the FRQ in the AP Precalculus CED, shall we?
“Students who completed a class participated in a year-long study to see how much content from the class they retained over the following year. At the end of the class, students completed an initial test to determine the group's content knowledge. At that time , the group of students achieved a score of 75 out of 100 points. For the next 12 months, the group was evaluated at the end of each month to track their retention of the content. After 3 months , the group's score was 70.84 points.
The group's score can be modeled by the function given by , where is the score, in points, for month , and is the number of months since the initial test.”
A.
- i. Use the given data to write two equations that can be used to find the values for constants a and b in the expression for .
- ii. Find the values for and as decimal approximations.
Credit to: AP Precalculus CED FRQ 2 (Page 148)
So as we can see, the CollegeBoard starts by giving us the scenario and an equation we can use to model the scenario.
Question A Part I:
This part will ask us to write multiple equations to solve for the constants of the variable. The amount of equations we have to write match the amounts of constants in the equation.
To solve this part, the scenario will always include at least the same amount of input and output values (See Unit 1.1: Change in Tandem ) as the amount of equations we need to make.
All we need to do is substitute those input values and output values into the equation exactly. In this case, those values are and . Plugging those in, we get:
Scoring Guide: It is important to note that for this question DO NOT attempt to simplify the equation and leave it as is after you enter your input-output values. Point 1 is scored for two equations that can be used to solve for constants a and b.
Question A Part II:
This part is really easy to solve with Desmos. Instead of utilizing the equations we found above to calculate our answers, we can easily use Desmos to find the constants. This will work no matter the equation that models the scenario.
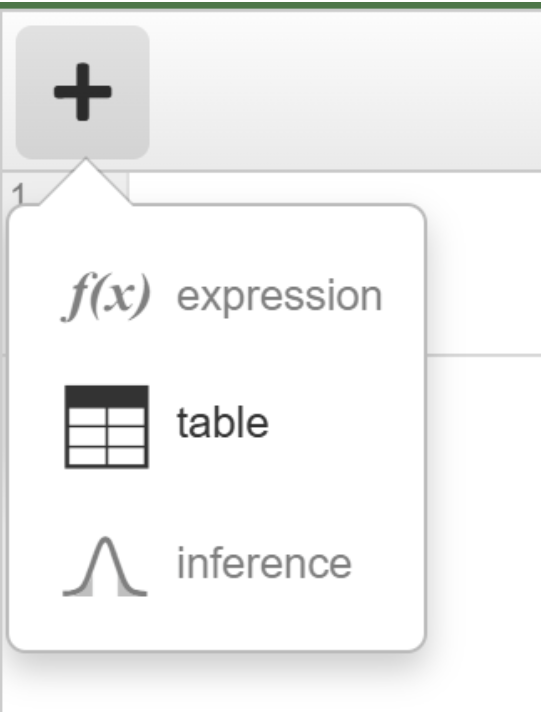
- Hit the plus button in the top-left of Desmos and add a table.
- Enter the input-output values in Part I into the table.
- On a new line, enter the model equation with and as the variable names for input/output values respectively and with the sign replaced with a sign. In this case, . Note: In desmos, if you type x1, it will automatically make it and the same applies for y1. Your variable names must have subscripts in them, or Desmos will not calculate regressions.
- This will populate the and constant values for you. You can ignore the statistics and residuals sections.
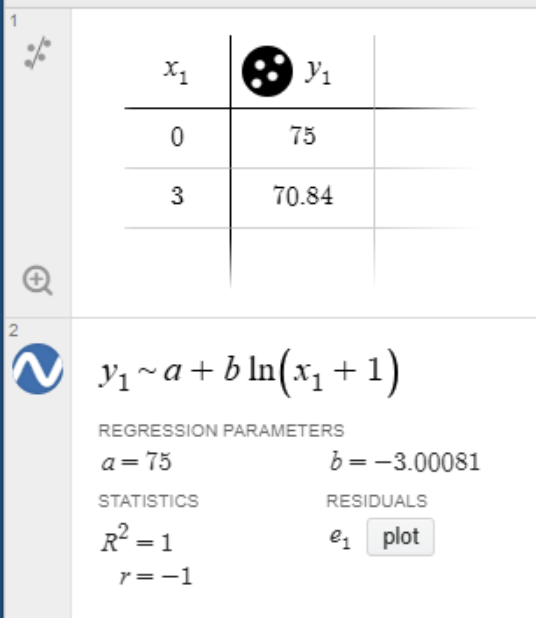
This is how it should look after completing the steps.
With those values, write the equation that models the situation with the constants plugged in.
Your final answer should be:
Scoring Guide: The second point is awarded for values of a and b in the form of an equation or as standalone values.
PART B - Rate of Change in the Real World:
Continuing with the same FRQ:
B.
- i. Use the given data to find the average rate of change of the scores, in points per month, from to months. Express your answer as a decimal approximation. Show the computations that lead to your answer.
- ii. Interpret the meaning of your answer from part B (i) in the context of the problem.
Part B will always ask us to find the rate of change between two input values given in the scenario and interpret the meaning of the rate of change in the scenario
(See Unit 1.2: Rates of Change).
Question B Part I:
This part is as simple as .
Regarding showing your work, we recommend utilizing signs for each step of your work. In this case you would write:
is the average rate of change.
Make sure to write the first expression, as it shows understanding of the slope formula and where the values used in the equation come from.
Scoring Guide: The third point is earned for expressing the average rate of change as a decimal approximation as a result of a division expression with differences resulting from given data (the average rate of change formula).
Question B Part II:
This part is just explaining what the rate of change means in terms of the scenario. A template for this is:
The average rate of change shows us that during the period [input-value variable]= [] to [] [unit of input value], on average, [unit of output value] [change: increase or decrease] at a rate of [absolute value of AROC] [unit of AROC].
So applying this to the FRQ, we get:
“The average rate of change shows us that during the period of 0 to 3 months, on average, student grades decrease at a rate of 1.3866 points per month.”
Note: This question used to have a Part iii, but this was changed for the 2026-27 school year, additionally, Part ii has completely changed.
Scoring Guide: The fourth point is earned for the explanation of the average rate of change with the correct units.
PART C - Domain Restrictions:
Continuing with the same FRQ,
C. The leaders of the study decide to use model to make predictions about the group's score beyond 12 months (1 year). They determine that the model is appropriate to use until the group's predicted score is below 65. Use model to respond to the following.
- i. Write and solve an equation whose solution gives the time , in months, when the group's predicted score is 65. Express your value for as a decimal approximation.
- ii. Explain how the value for found in part C (i) can be used to determine an appropriate domain restriction for the model . Refer to the context of the question in your explanation.
This is definitely the hardest part of this FRQ for most people, don’t worry though I got y’all!
Question C Part I:
This is also pretty simple to solve in Desmos,
- Ensure you still have the graph from Question A Part II. Note that you might not see the graph due to its location on the -plane, zoom out until you find it and then zoom back into the graph.
- On a new line write the equation (the output value given by the question). In this case that would be
- The point where those graphs intersect is your answer as a decimal approximation.
It should look like this when you’re done:
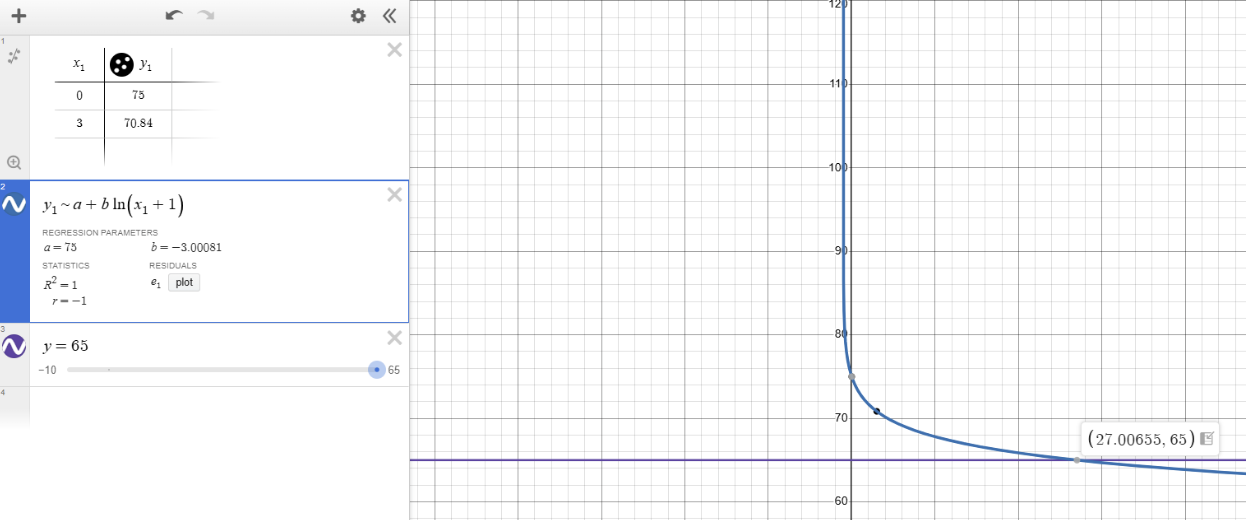
As for the actual equation, simply take the equation you found in Question A Part II and set your output value to the value given by the question, in this case 65. As such, you would write:
months (Units are important!)
Make sure you include , it makes sure that CollegeBoard understands that you know that 65 is the output value.
Scoring Notes: Point 5 is earned for the value of t and that value being correctly utilized in the equation.
Question C Part II:
For this section you simply need to explain that the domain is limited to the -value in Part I. A template for this is:
The model function only works until [output value in C Part I] [unit of output values] because [limitation set in the question], so, it will only work for [-value of the output given in the problem] [unit of input values]. The initial data point given was [] because that is when [reasoning why was initial value]. Therefore, the domain is limited to [,(-value of the output given in the problem)].
It is important to use critical thinking to understand why the is the initial value. For example, in this case, is 0 because that is when the initial test was given. It will usually be 0 in most scenarios because most things don’t go into the negatives in the real world. Therefore, for this question you would write:
“The model function only works until a score of 65 because that is when the leaders of the study determine that the model is no longer accurate, so it will only work for 27.0065 months. The initial data point given was 0 because that is when the initial test was given. Therefore, the domain is limited to [0,27.00650].”
Note: Question C Part ii didn’t use to exist, this changed for the 2026-27 school year and onwards.
Scoring Guide: The sixth point is earned for the explanation of the domain limitation in the context of the problem.
Model FRQ:
Before we end this guide, here is a model FRQ and its response that would earn full points.
Question 2:
Aaron bought a gaming PC in 2020. In the years following, Aaron’s PC’s value increased. In 2020, at () the gaming PC cost $2146.64. Two years later, at () the gaming PC was worth $3177.54.
The value of the gaming PC can be modeled by the function given by , where is the value, in dollars, for the year , and is the number of years since the gaming PC was bought.
A.
- i. Use the given data to write two equations that can be used to find the values for constants and in the expression for .
- ii. Find the values for and as decimal approximations.
B.
- i. Use the given data to find the average rate of change of the gaming PC’s value, in dollars per year, from to years. Express your answer as a decimal approximation. Show the computations that lead to your answer.
- ii. Interpret the meaning of your answer from part B (i) in the context of the problem.
C. Economists analyzed PC market trends using this model and determined that the model accurately predicts the gaming PC’s value until it reaches $6,972.32.
- i. Write and solve an equation whose solution gives the time , in years, when the gaming PC’s value is $6,972.32. Express your value for as a decimal approximation.
- ii. Explain how the value for found in part C (i) can be used to determine an appropriate domain restriction for the model . Refer to the context of the question in your explanation.
Solution:
A-i:
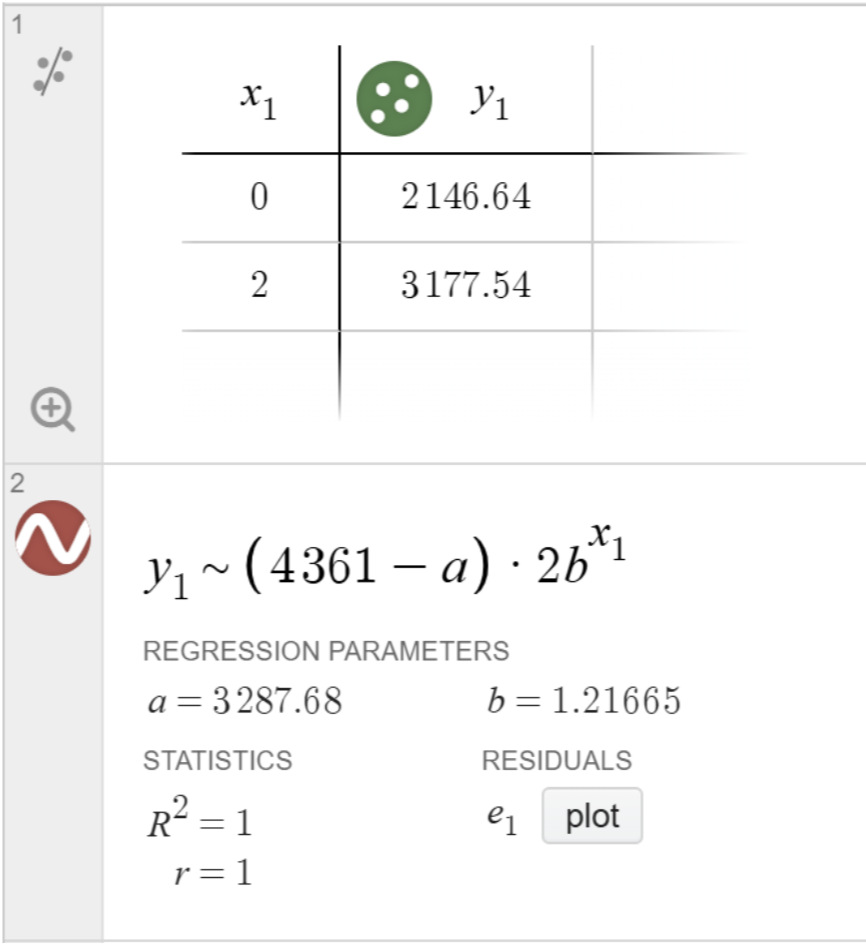
A-ii:
Remember to use Desmos!
B-i:
is the average rate of change.
B-ii:
Remember the unit of the rate of change!
The average rate of change shows us that during the period 0 to 2 years, on average, the gaming PC’s value increases at a rate of 515.45 dollars per year.
C-i:
Remember to use Desmos!
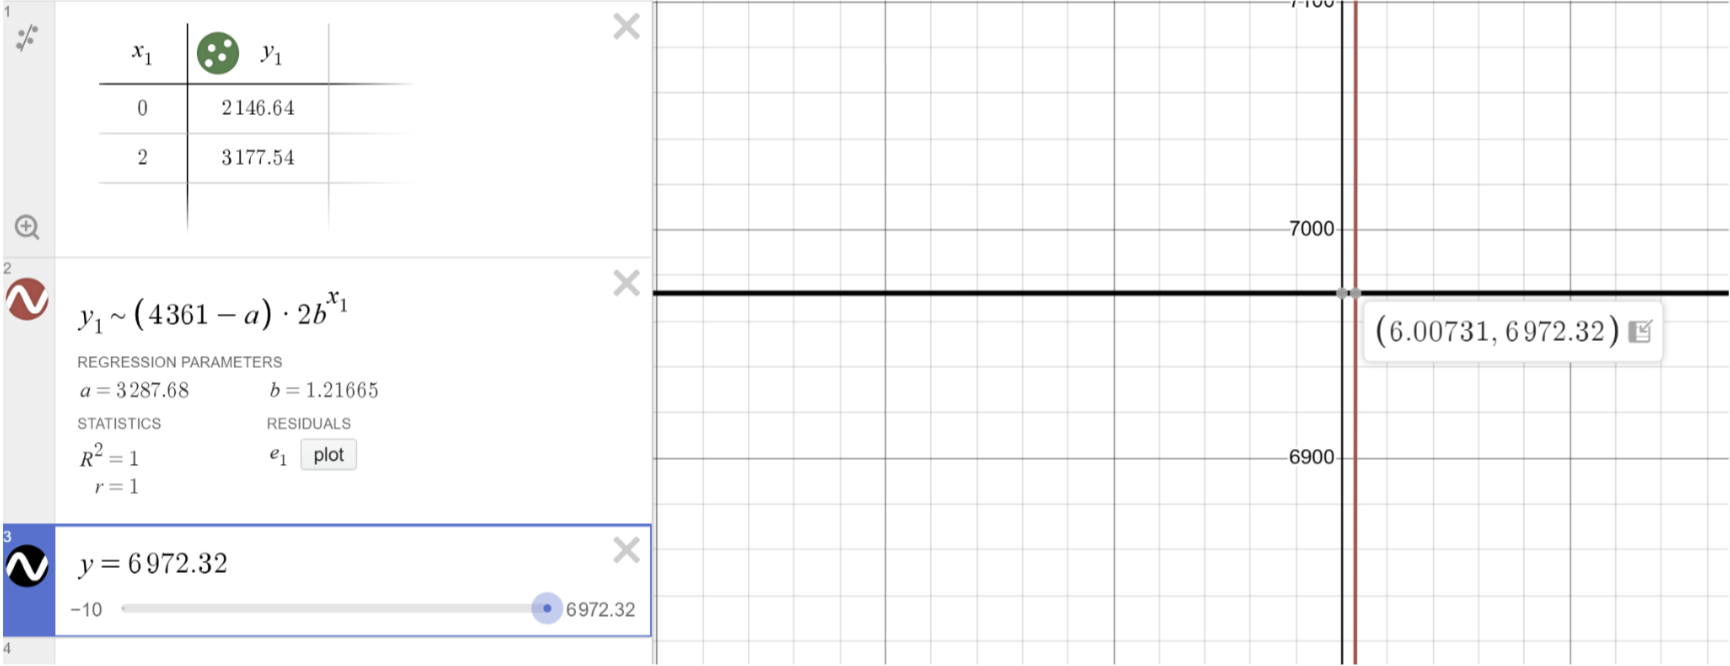
years
C-ii:
The model function only works until $6972.32 because economists believe that after this value, the model does not accurately predict market PC trends, so, it will only work for 6.0073 years. The initial data point given was 0 because that is when Aaron bought the PC. Therefore, the domain is limited to .
Keeping in mind the changes for this FRQ, you can find previous years FRQs to prepare at AP Precalculus Exam Questions. That’s it! Good luck on the exam!