
Introduction
Welcome to the guide for FRQ #3, Modeling a Periodic Context! This guide will teach you exactly what the AP graders expect and go over a star example for a custom FRQ made just for the article.
This is the most scripted FRQ on the exam. If you can get a basic grasp of this and other FRQs on the CollegeBoard’s website, you’ll be more than prepared for the actual exam!
The Context
The FRQ starts by presenting a context with a periodic function:
A ceiling fan rotates in a counterclockwise direction at a constant rate, completing revolutions in second. At time , point on the edge of a fan blade starts at its leftmost position, feet to the left of the vertical centerline (see figure). It then passes through the centerline and moves to its rightmost position, feet to the right of the centerline.
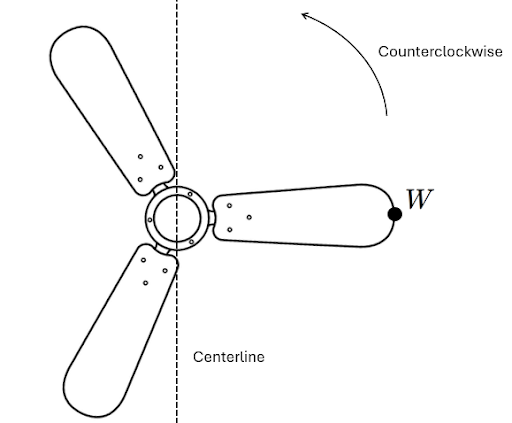
The sinusoidal function models the signed displacement of point , in feet, from the vertical centerline as a function of time , in seconds. A positive value of indicates the point is to the right of the centerline; a negative value of indicates the point is to the left of the centerline.
Understanding the Context
When reading the problem statement, first it is good to read the problem in full and look at the diagram (if provided) to understand what you’re dealing with. However, there are a few key pieces of information you will need to know:
-
The period or frequency, or any number which states the rate at which each periodic motion takes place. In this problem, it is presented as the frequency, “ revolutions in second.” We know that the period is because the period is defined as .
- For a refresher on what the period or frequency is, read this article.
-
How the scenario is interpreted on the graph. In this problem, it is presented as, “A positive value of indicates the point is to the right of the centerline; a negative value of indicates the point is to the left of the centerline.” In other words, the bottom of the graph represents the displacement to the left, and the top of the graph represents a displacement to the right.
- It is very important to make this distinction. Sometimes, the scenario may be given differently, such as measuring the distance to the leftmost position. Read the problem carefully.
- The minimum value. In this problem, it is presented as, “its leftmost position, feet to the left of the vertical centerline”. We know the minimum value deviates feet as the point, at its furthest position from the centerline, is feet away.
-
The maximum value. In this problem, it is presented as, “rightmost position, feet to the right of the centerline.” We know the maximum value deviates feet by a similar logic.
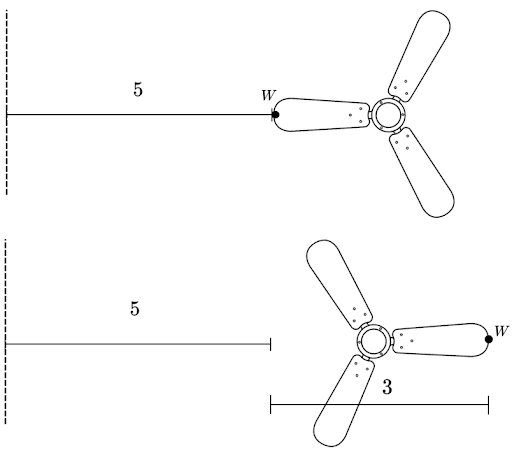
- Sometimes, the two values may not be identical. For instance, the point of measurement may be deviated. Imagine a scenario measuring point from a nearby wall, feet from its leftmost position, with feet between its leftmost and rightmost positions. You must account for a vertical shift here to get the range . It may be helpful to draw a diagram.
Part A – Label the Points:
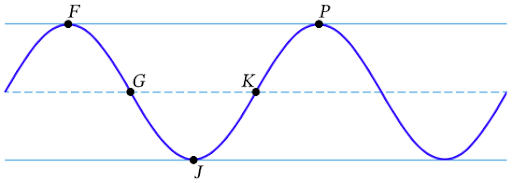
The graph of and its dashed midline for two full cycles is shown below. Five points, , , , , and are labeled on the graph. No scale is indicated, and no axes are presented.
Determine possible coordinates for the five points , , , , and .
Tackling the Problem
Make note that and . Use .
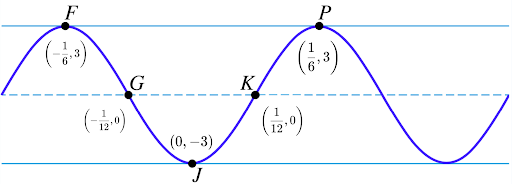
First, make sure you start your at the correct position. In this case, the problem defines as the leftmost position, feet to the left. Remember that the problem defines left as the minimum value. In other words, point is the “leftmost” point of the graph despite points and being “more left” because the scenario’s centerline is vertical rather than horizontal, and the problem defined left as having a lower -value. As such, mark point as .
It is recommended to mark the other extrema first. The problem tells us that the maximum value is . Then, mark and as . We can focus on marking the -values (period) later.
You may also want to mark the midline points and now. Simply mark their -values as the average of the two extrema, which can be calculated as . In this case, the middle of and is . and are .
From here, you can start to mark the intervals. Remember that the fan rotates times every second. Thus, the fan takes second (the reciprocal, or ) to complete one rotation. The graph therefore has a period of .
We know that and both are half a period away from . So, to get their positions, we just divide by to get . Because the time increases when you move right, and .
To get to and , we notice they are a fourth-of-a-period away. Following similar logic, we get , thus , .
Remark: It is absolutely okay to do a phase shift by the period, as the graph is periodic. It is also absolutely okay to have a negative time.
Please do not leave the question blank. You are eligible to earn partial credit as long as your points form a coherent sinusoidal function.
Full-Marks Answer
Part B – Finding the Constants:
The function can be written in the form . Find values of constants , , , and .
Remark: You can read this article for a refresher on the variables of sinusoidal functions!
Tackling the Problem
First, we must identify the function type we are asked to graph. Here, we are asked to graph a graph.
Next, we must identify a ‘root’ coordinate/dot. This is not necessarily the spot where . Rather, pick a point that makes your life easier (the graph looks like that at on the parent function). It is always recommended to pick point for graphs and point or for graphs. While you do not need to pick that point, it makes your life so much easier.
Let's go with for this example.
Next, remember the meanings of each of the variables. stands for the amplitude, stands for the angular frequency (defined as ), is the negative of the phase shift (-coordinate of the root point if you picked correctly, remember that the equation provided is !), and stands for the vertical shift (-coordinate of the midline).
Remark: It is encouraged to use the picture you drew in Part A to fill in the blanks here! This is because, according to the CED, you can still earn full marks on this question by following the graph you labelled in Part A. Even if the labels are completely wrong, as long as your answer in Part A makes sense (partial credit)! It is strongly discouraged to purposely input arbitrary numbers on Part A to have an easier Part B.
Full-Marks Answer
Part C, I – Behavior of the Graph:
Refer to the graph of in part A. The -coordinate of is , and the -coordinate of is .
On the interval , which of the following is true about ?
- is positive and increasing
- is positive and decreasing
- is negative and increasing
- is negative and decreasing
Tackling the Problem
This question is asking you about the behavior of the graph. A positive graph means the interval’s -values are positive, and a negative graph means they are negative. Whether a graph is positive or negative has no relation with the dashed midline.
Similarly, an increasing graph means the interval is going up, and a decreasing graph means the graph on the interval is going down. This has no relation to the graph’s concavity.
This is a multiple choice question. Simply write the letter and move on.
Remark: It is always better to just write the letter. If you write out the entire answer choice, the AP Reader will only grade that, and you risk losing points over a transcription error.
Remark 2: This question is solvable just by looking at the picture provided, without any context. You can still earn full marks on this question without answering parts A and B.
Full-Marks Answer:
D
Part C, II – Concavity Practice:
On the interval , describe the concavity of the graph of and determine whether the rate of change of is increasing or decreasing.
Tackling the Problem
This is where you talk about the concavity of the graph. You will need to describe the concavity of your graph on the interval given to you in Part C, I. Luckily for you, there is a simple way to get full credit without writing too much or using too much brainpower much like the other essay questions on this exam.
The AP Readers are looking for a few things when grading:
- graph name
- interval
- concavity
- rate of change behavior
You can make a short template beforehand and just use that on the exam, since you will only need to convey that information. Here is an example.
On the interval , the rate of change of {function name} is {increasing/decreasing} because {function name} is {concave up/down} on the interval .
Remember to ensure you are talking about the rate of change rather than function behavior. If you struggle with identifying concavity, imagine the portion of the graph next to a parabola. If the portion matches a piece of an upright parabola (or a smiley face), it is concave up. Likewise, if the portion matches a backwards/upside-down parabola (or sad face), it is concave down.
- Extra information about concavity can be found in this article.
Remark: You must specify the concavity as well as the rate of change. Only saying one (including “increasing/decreasing at an increasing/decreasing rate”) will not earn you the point.
Full-Marks Answer:
On the interval , the rate of change of is increasing because is concave up on the interval .
Extra Practice and Final Comments:
This FRQ mainly tests you on graphing and writing equations of sinusoidal functions, as well as their function behavior. If you struggle with this FRQ, begin by reviewing these.
As stated previously, this FRQ is heavily scripted and predictable. Try to understand every step taken to solve each problem. All that changes on the AP Exam are the numbers and scenario.
Like other FRQs, there are some released FRQs from past years. They can be found here. The Course and Exam Description also has a sample FRQ. You can find it here.
Good luck!