
Period / Frequency
The period of a function is the minimum positive value such that for all values of x. Note that must not be a constant.
Let’s take a look at the graph of the function .
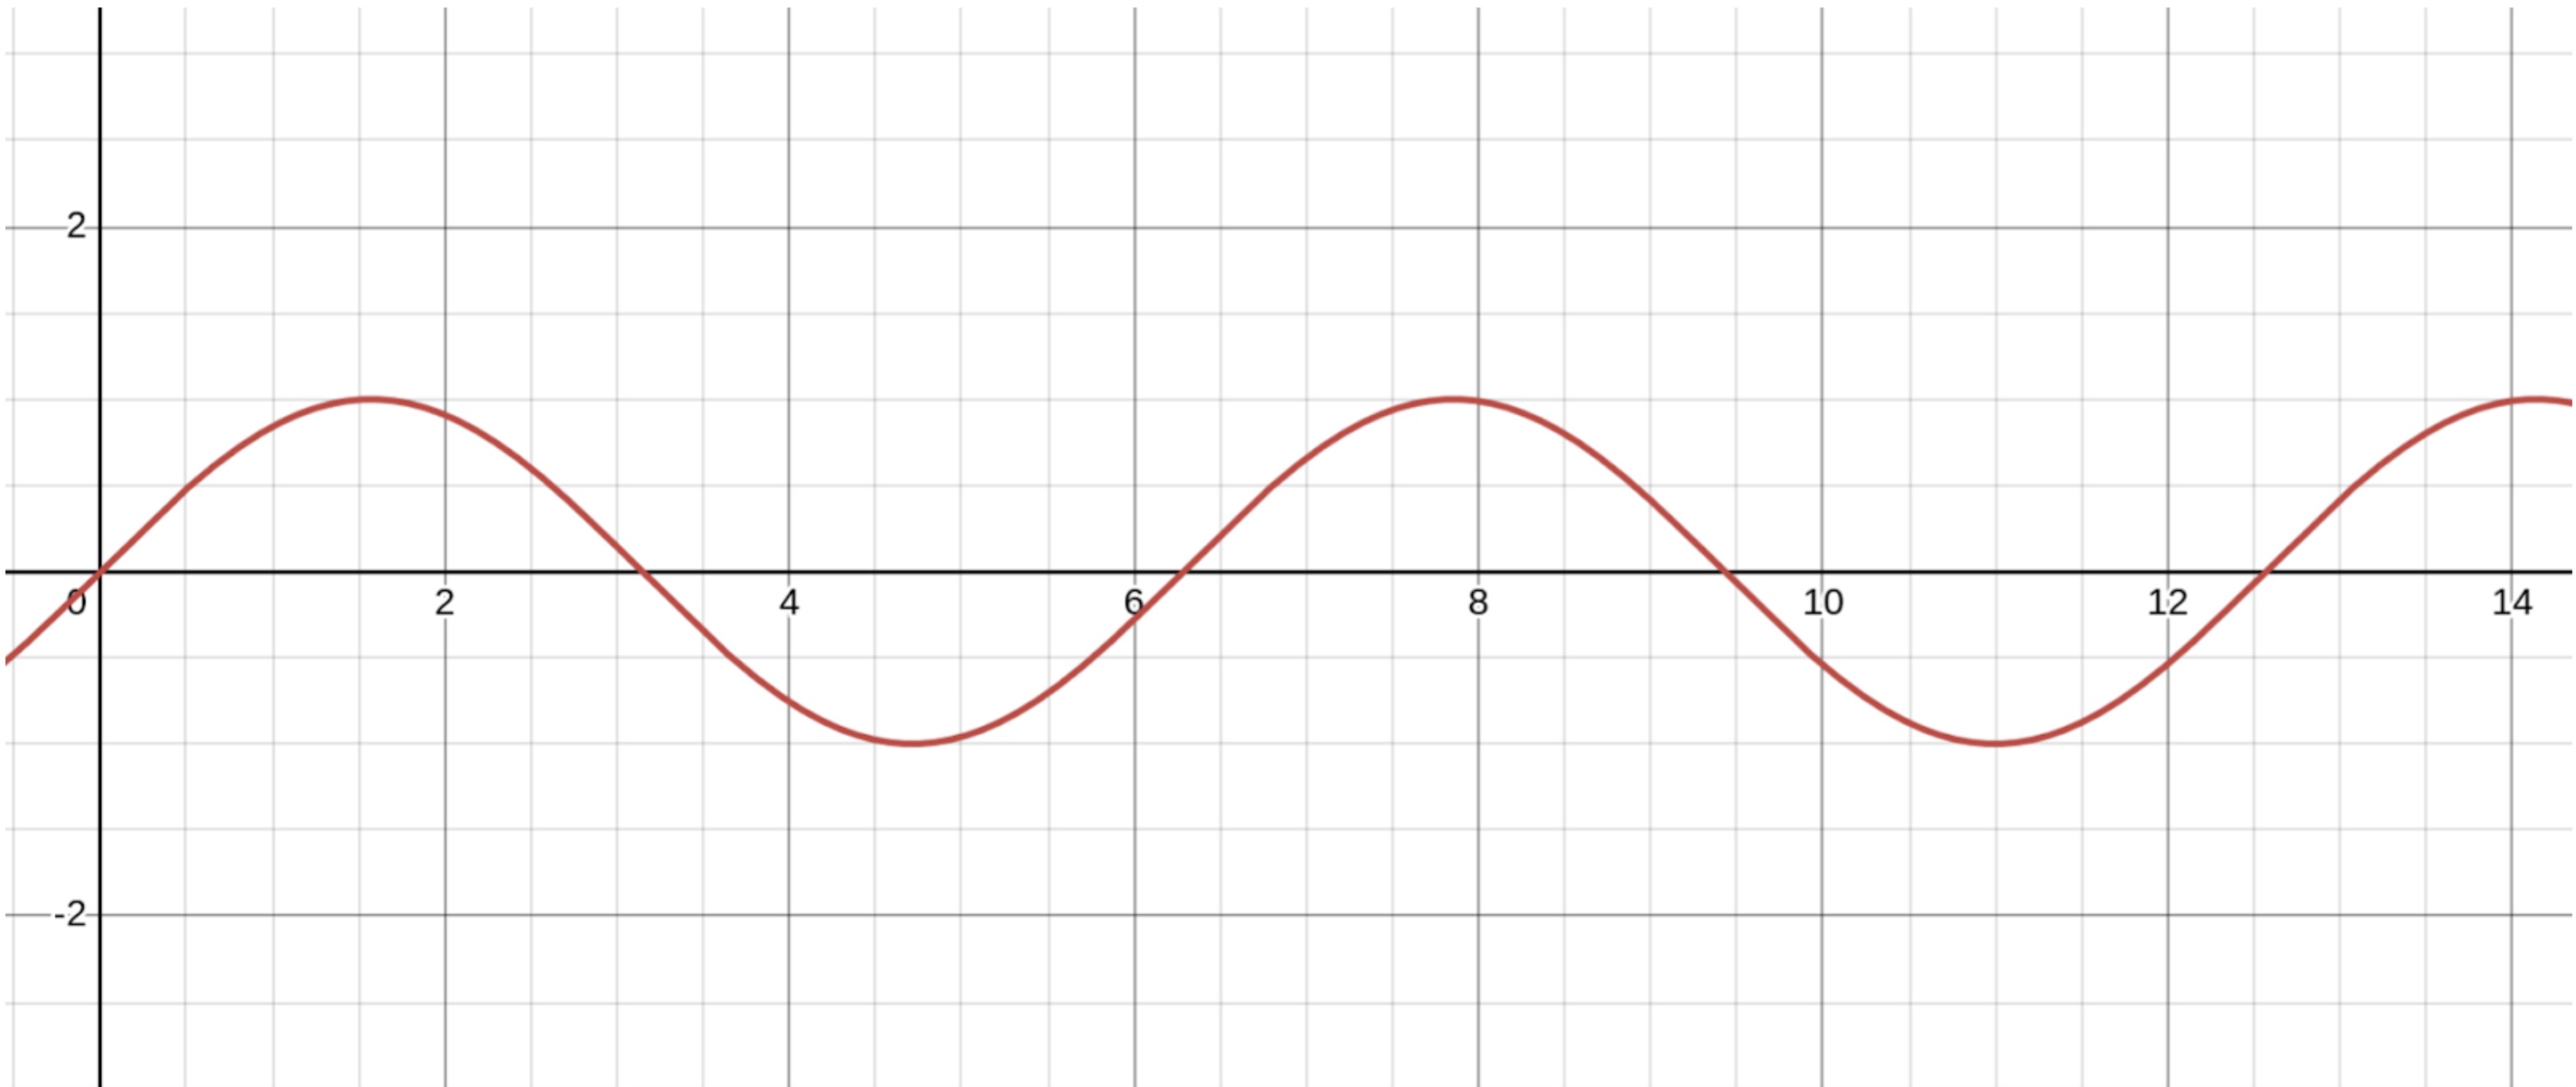
Notice that the function repeats every so often, specifically every units.
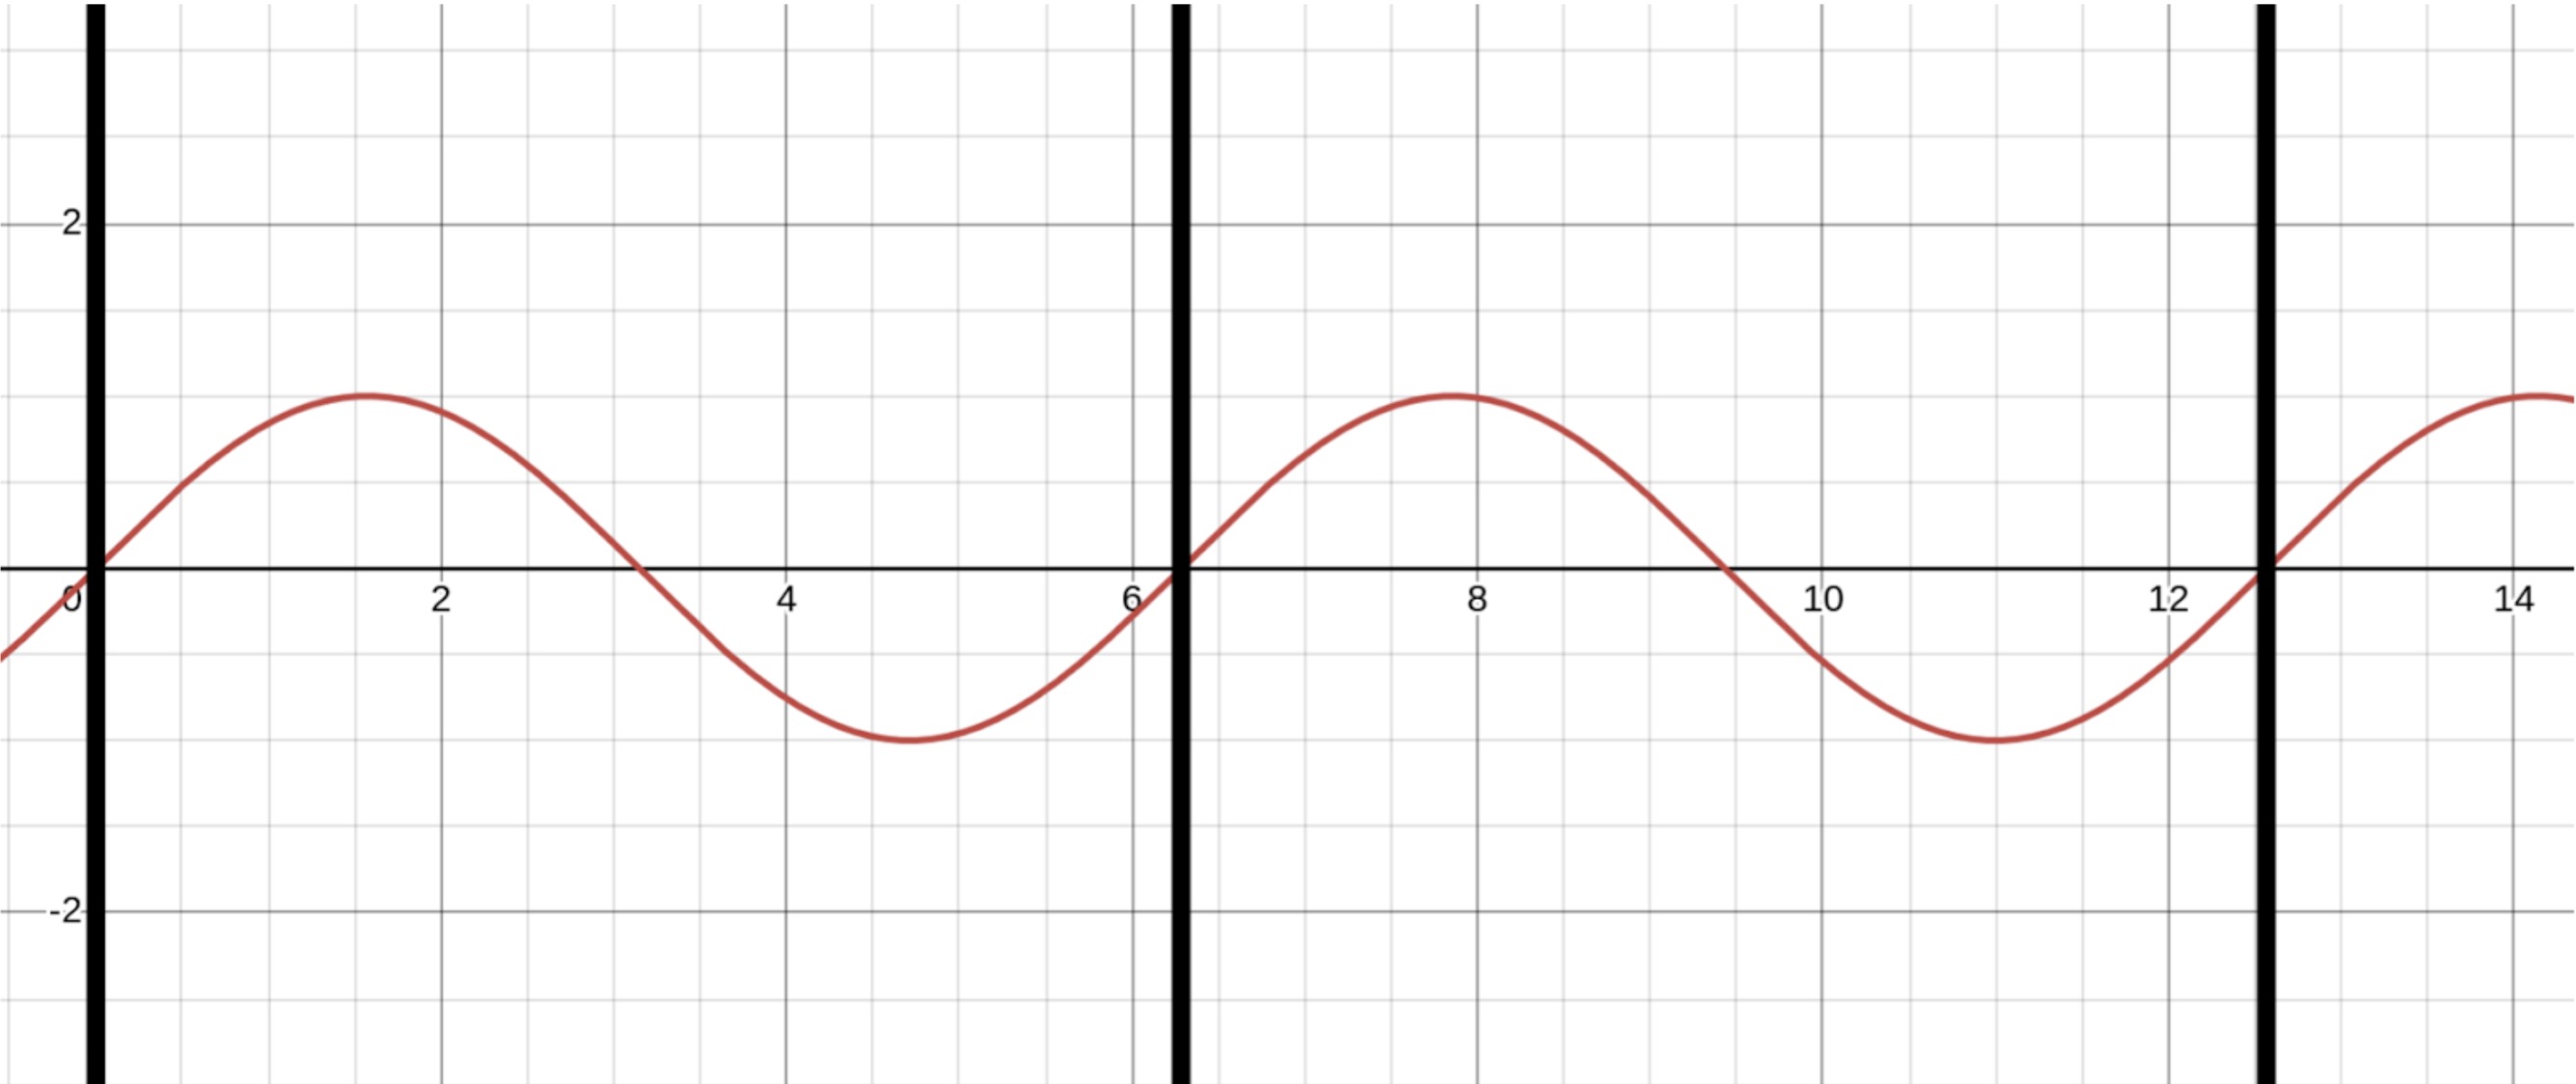
For each, which are spaced units apart, the outputs of the function in between the black lines are the exact same. This means that the period of the function is .
An additional property of periodicity is that if has a period of , also has a period of for all values of , or in other words, a horizontal shift of a function doesn’t change its periodicity. This means that, since , the periodicity of is also .
Frequency
The frequency of a sinusoidal function is the number of times a sinusoidal function repeats itself over an interval of . The frequency of a sinusoidal function is , where is the period of the function. In the general equation for a sinusoidal function, , is equal to the frequency.
Amplitude / Vertical Shift
The amplitude of a sinusoidal function is equal to the height that one of its waves makes.
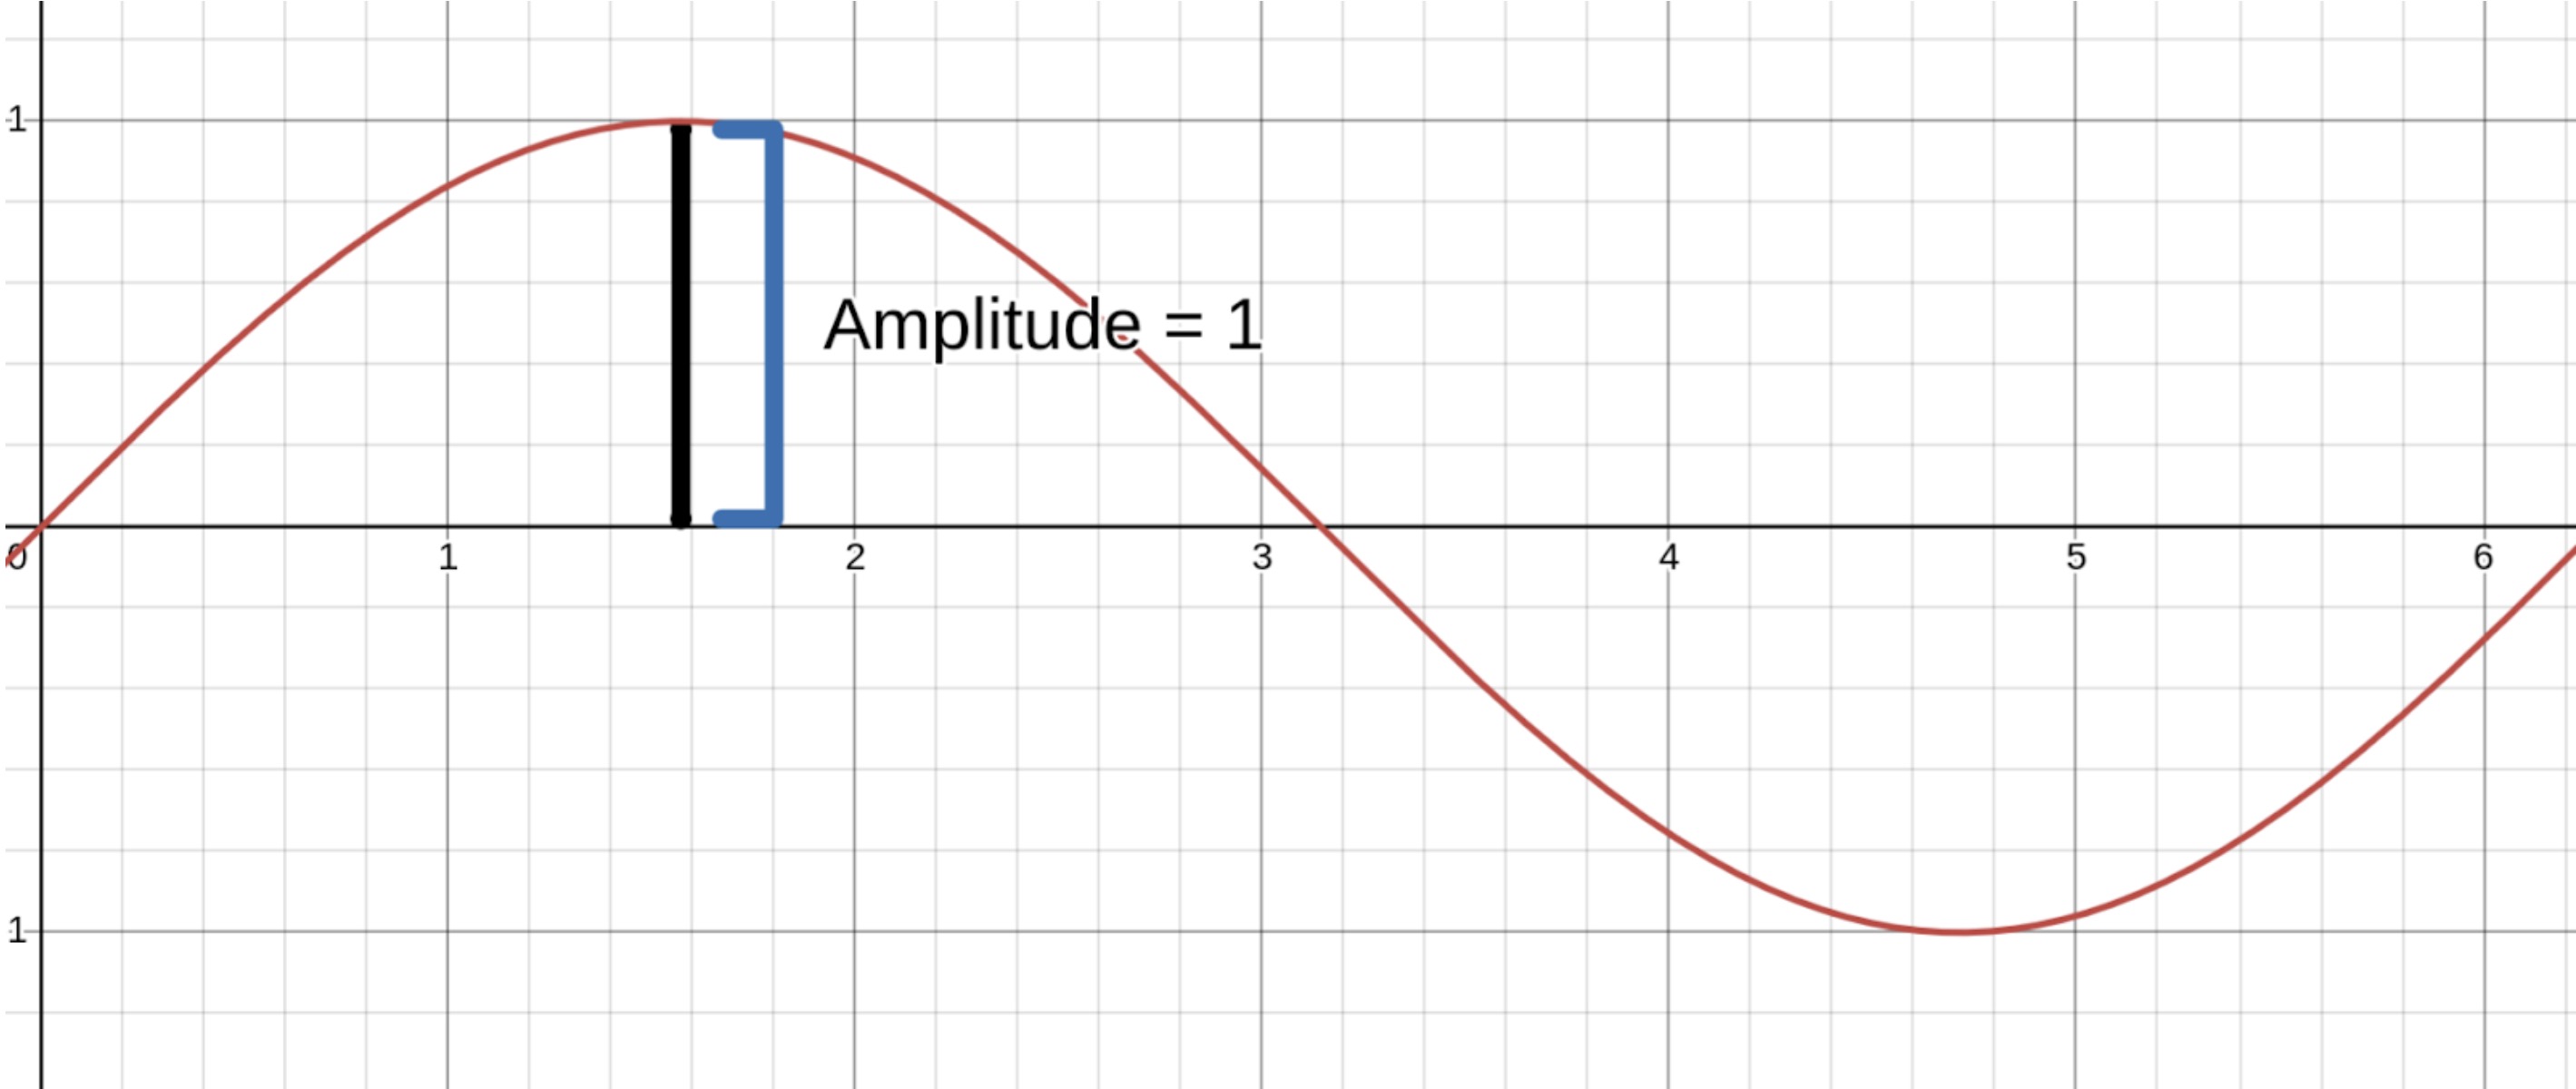
To find the amplitude of a sinusoidal function, we can use the formula . Since the height of the waves of a sinusoidal function is the same both when the function is negative and positive, the total height of a wave, or the amplitude, is equal to half of the total height of the function.
So far, we have only discussed sinusoidal functions that have a midline, or center, at . That won’t always be the case, as seen in the graph below.
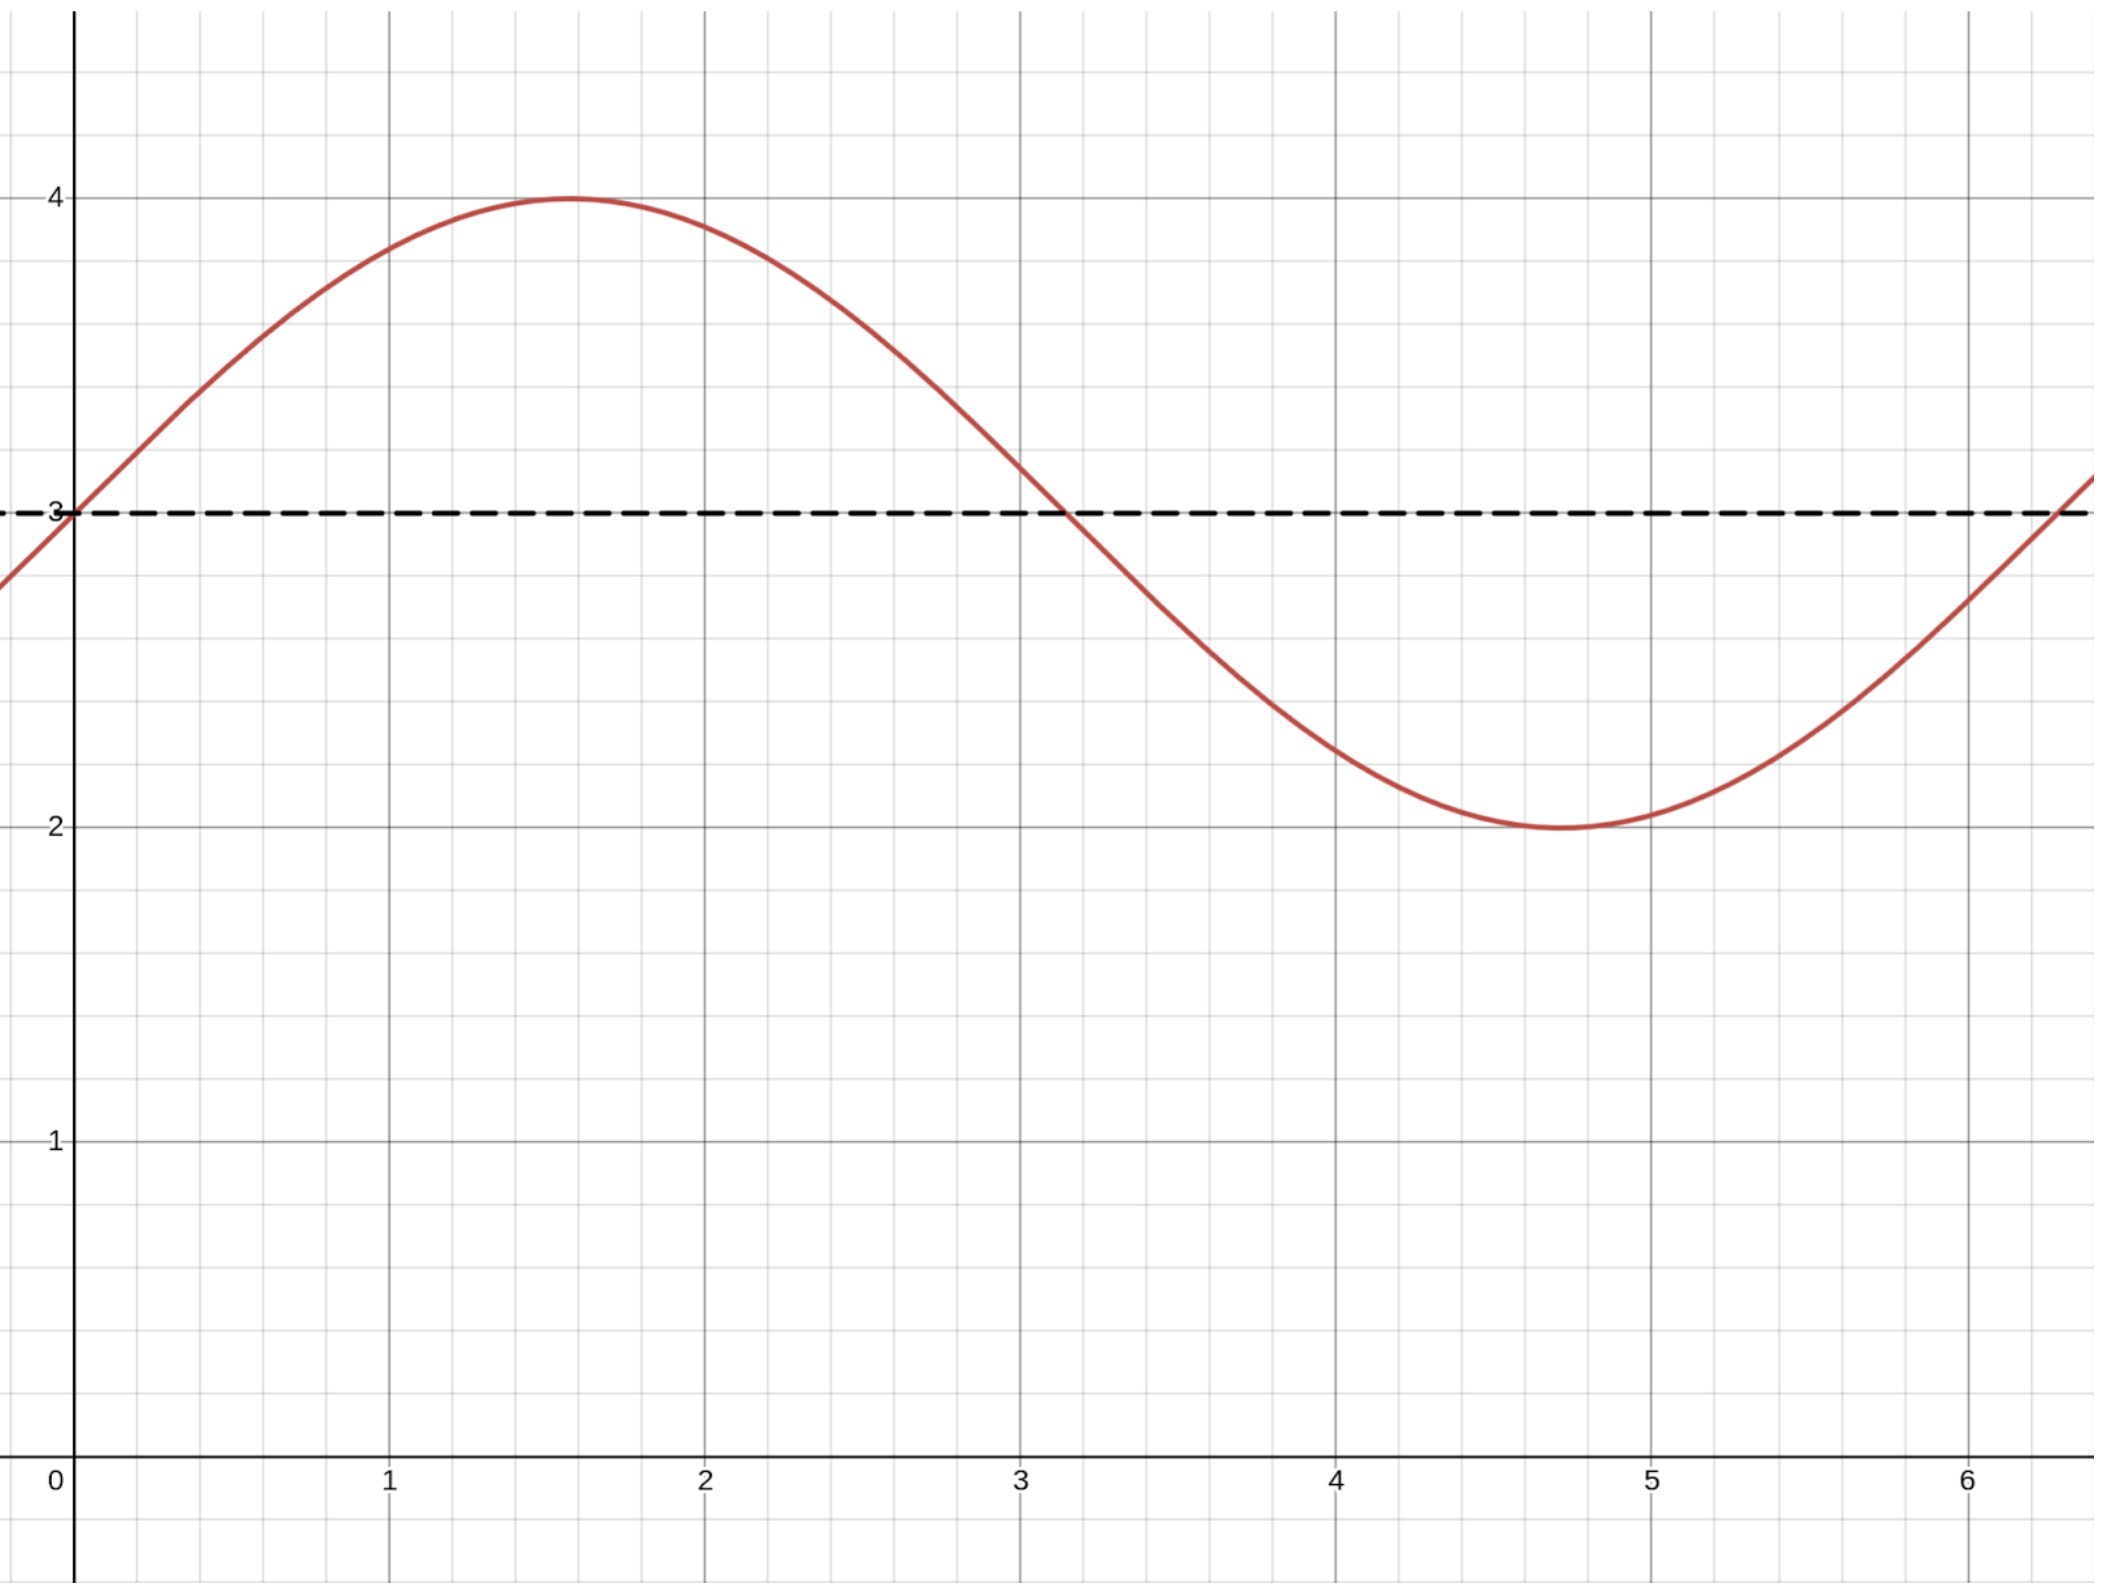
This graph has a midline at . To find the midline, we can take advantage of the fact that the waves below the midline have the same height as the waves above the midline, so the height of the midline is . The height of the midline is also called the vertical shift.
Finding the equation for a sinusoidal function given a set of points
With a Calculator
We will be using Desmos for this, as you are provided it on the AP Exam. For usage of a personal calculator, please consult your calculator’s manual: do note that your calculator might not have the ability to do custom regressions, in which case you will have to settle for what you can.
- Click on the plus icon and add a table, and fill in your values
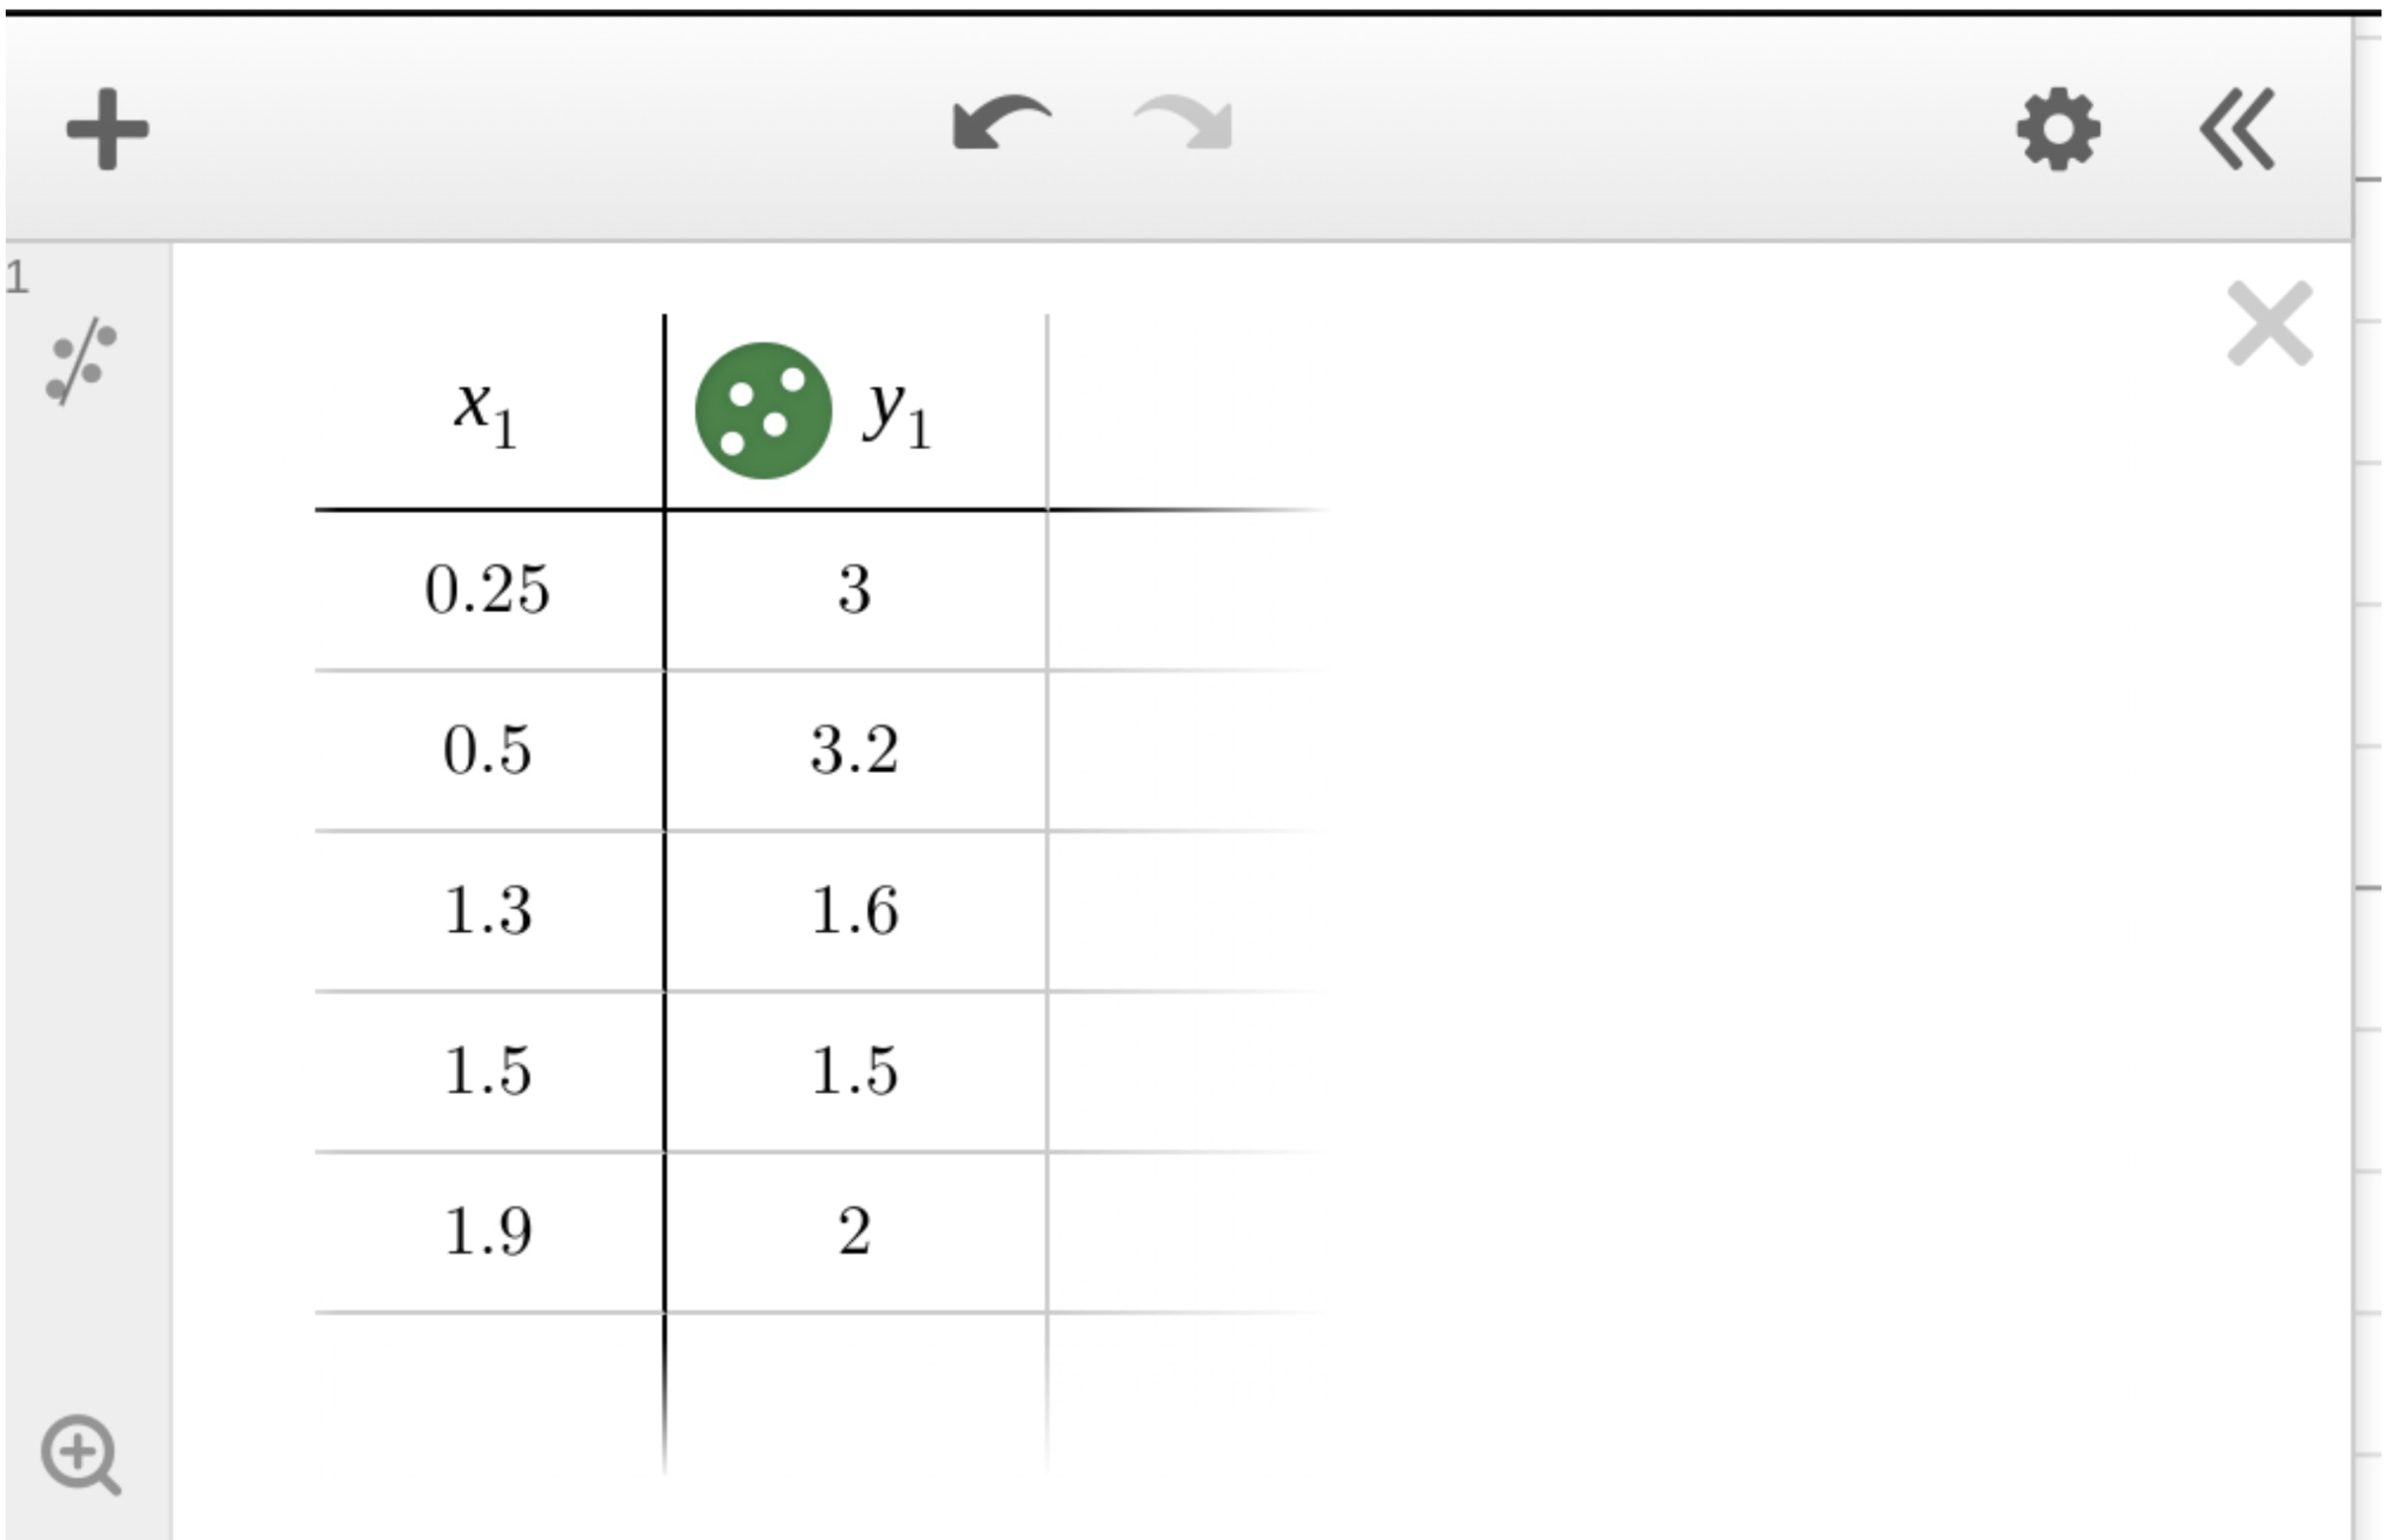
- Without deleting your table, type in the following equation. To type the subscript, or the small text after and , use the underscore: _. Note that an equals sign is not used, rather, a tilde (~) is used.
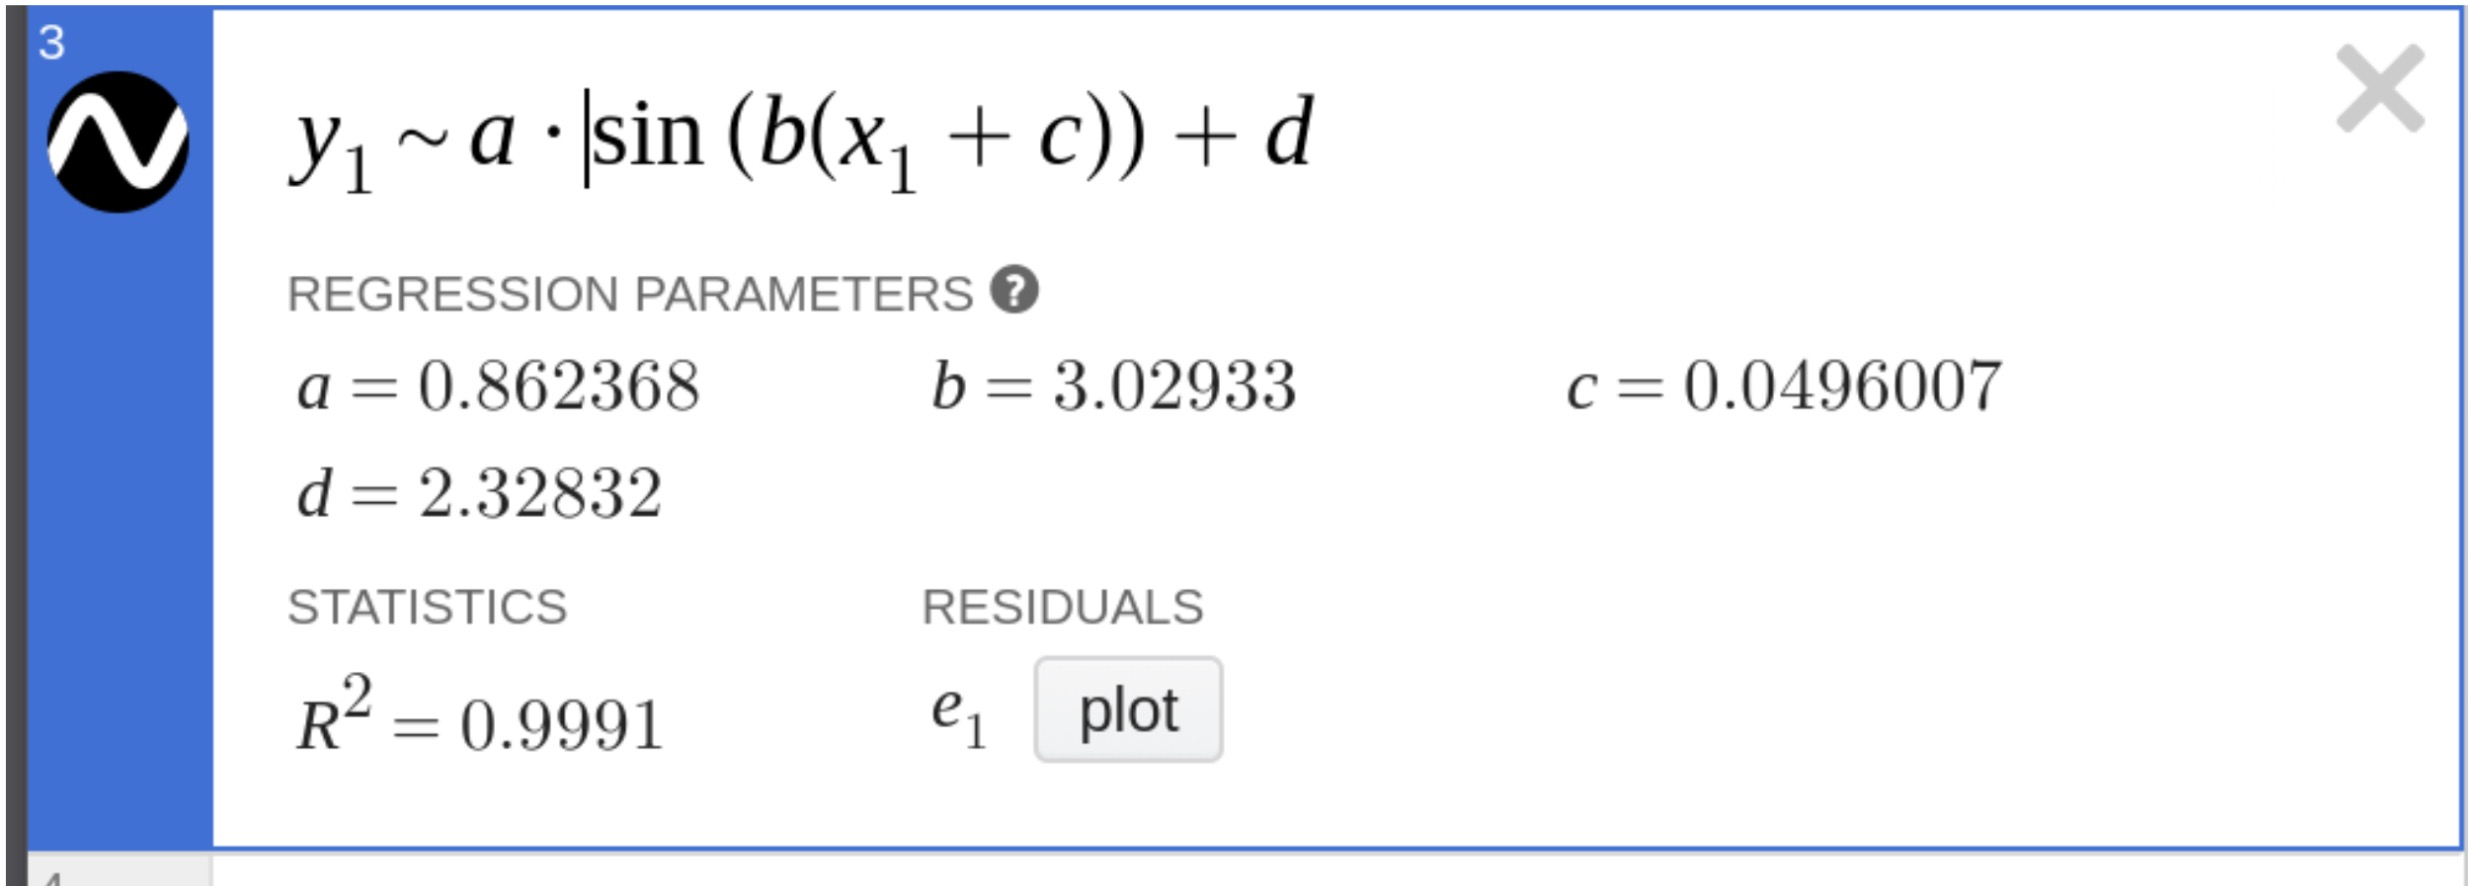
- Desmos will calculate the values of , , , and that best fit your dataset. It will also graph it for you.
Solving without a calculator
To find the sinusoidal function that matches a specific set of points given the general equation , follow the following steps.
- To find your amplitude: subtract the minimum -coordinate from the maximum -coordinate and divide by , this is your .
- To find the midline / vertical shift, take the average of the maximum and minimum y-coordinate: this is your
- To find your horizontal shift, we can take advantage of the fact that , and use our previously calculated vertical shift, . For any value that has a y-value equal to the vertical shift, let’s call it , set to .
-
Lastly, to find our frequency, let’s first find our period. We can do this in one of two ways:
- Find two coordinates with the same -coordinate where the -coordinate is equal to the maximum or minimum output of the function. The distance between those two points is the period.
- Find three coordinates with the same -coordinate where the -coordinate is not equal to the maximum or minimum output of the function. The distance between the first and third point is the period.
- Our frequency, or , is just , where is the period.