
Introduction
Beyond just analyzing the association of two variables by looking at a scatter plot, it’s important to be able to numerically analyze bivariate quantitative data. This topic will go over correlation and the correlation coefficient, a way to numerically determine the linear association between two variables.
Correlation Coefficient
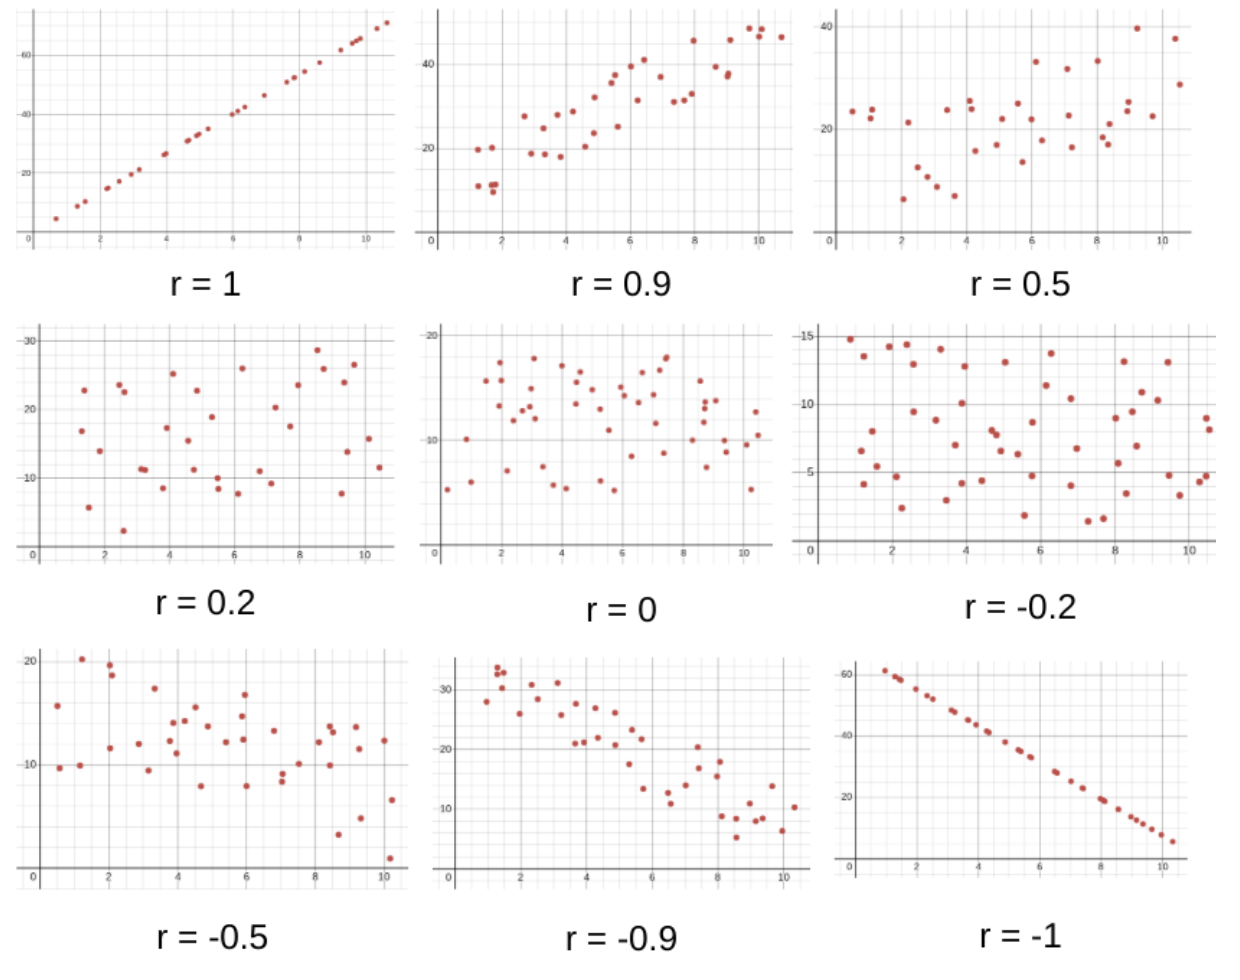
Correlation is a description of the linear association between two quantitative variables. The correlation coefficient, or , is the way we actually quantify how correlated the two variables are. The formula for is , but you will not need to calculate this value on the AP exam, and instead just understand what it means. is a unitless number that ranges from -1 to 1. The closer that is to , the stronger the correlation. The closer is to , the weaker the correlation. A positive value means a positive association and a negative value means a negative association. The sign of will always coincide with the direction of the association.
An important thing to keep in mind when looking at , is that while a high value does imply a strong linear association, it does not imply that a linear form is the best fit for the data set.
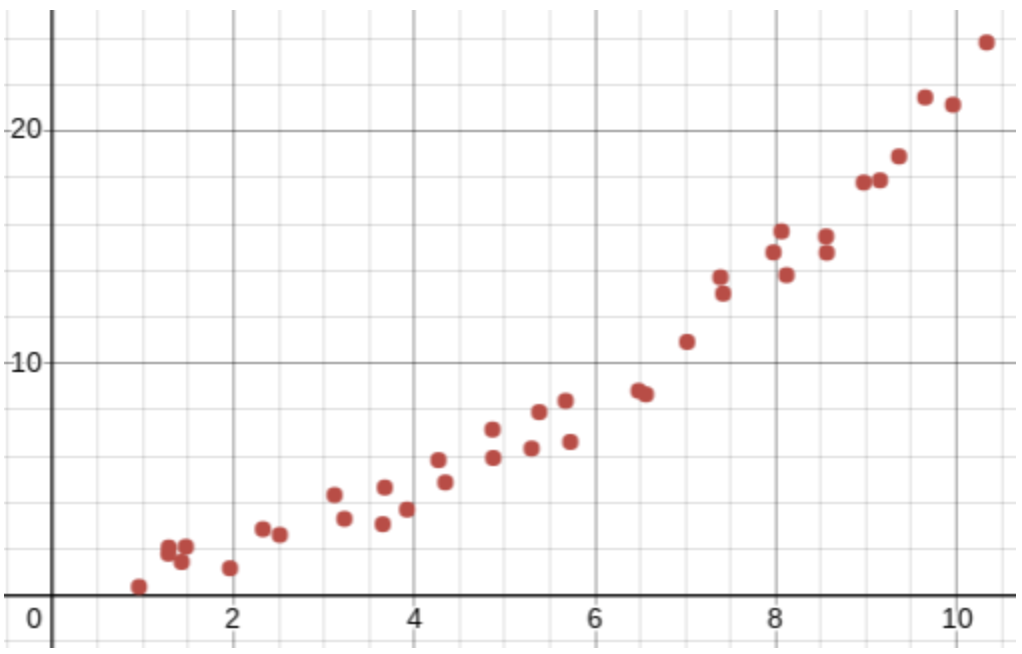
This scatterplot, for example, has a very high correlation, around , but is clearly curved, and so the association would be non-linear (in this case, quadratic).
As always, it is also very important to remember that correlation does not equal causation. Just because a scatterplot has a very high correlation does not mean that one variable causes the other, or even that the variables are related at all!