
Introduction
While there are many different ways to make linear regression lines, the most common one, and the only one needed for AP Stats, is the Least Squares Regression. This article will go over the Least Squares Regression and the interpretations of its coefficients.
Least-Squares Regression
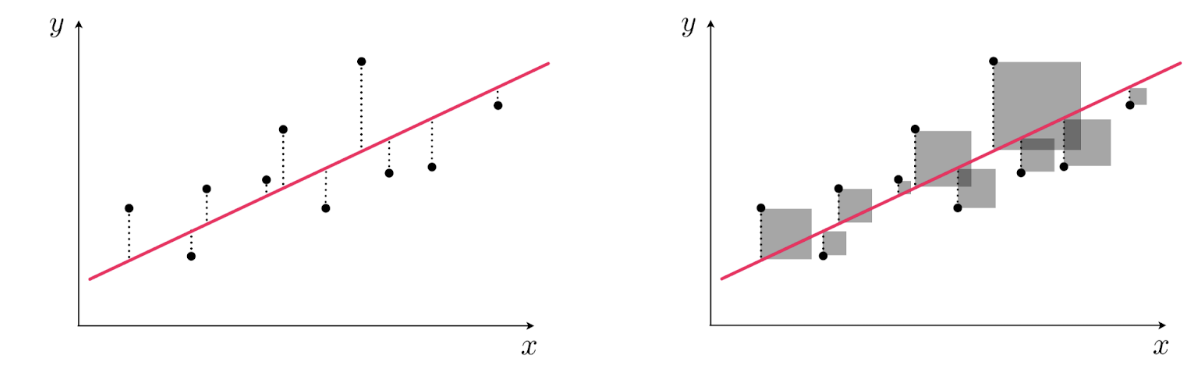
The least-squares regression is created by minimizing the sum of areas of squares formed with a side length based on each data point’s residual.
Like other linear regression models, the least-squares regression model uses the form . Calculating the coefficients manually is not required for AP Stats, and rather they will be calculated using technology, and provided whenever necessary on the exam. Due to the nature of how the least-squares regression is calculated, the line will always path through the point .
In a linear regression, squaring the correlation coefficient, , will produce the coefficient of determination, (often notated as ). is defined as the proportion of variance within the response variable that can be explained by the linear relationship with the explanatory variable. It is important to remember the definition of the coefficient of determination and be able to explain it in the context of a least-squares regression model. Additionally, remember that because is a squared value, it will always be positive, and so unlike it cannot be used to determine the direction of the model.
Interpreting a Least-Squares Regression
Simply having the least-squares regression line is not enough; interpreting the coefficients is where the importance of the regression is truly shown.
, the slope of the linear regression line, can be interpreted as the change in the response variable for every unit change in the explanatory variable.
, the -intercept, can be explained as the predicted value of the response variable when the explanatory variable is equal to 0. The predicted value of a linear regression will often not make sense in context. For example, models where the explanatory variable is the year will often have a nonsensical value for when the year was 0. Models may also give a predicted -intercept that is negative in a context where the response variable cannot be negative, like height. Determining if the -intercept is interpolation or extrapolation is a good indicator as to whether or not the value will make sense in context.