
Learning Objectives
- 7.9.A: Describe the types of evidence that can be used to infer an evolutionary relationship.
- 7.9.B: Explain how phylogenetic trees and cladograms can be used to infer evolutionary relatedness.
Introduction
Phylogeny refers to the evolutionary history and relationships among organisms. Often represented using cladograms and phylogenetic trees, these visualizations are important to understand as they appear often on the AP Biology exam.
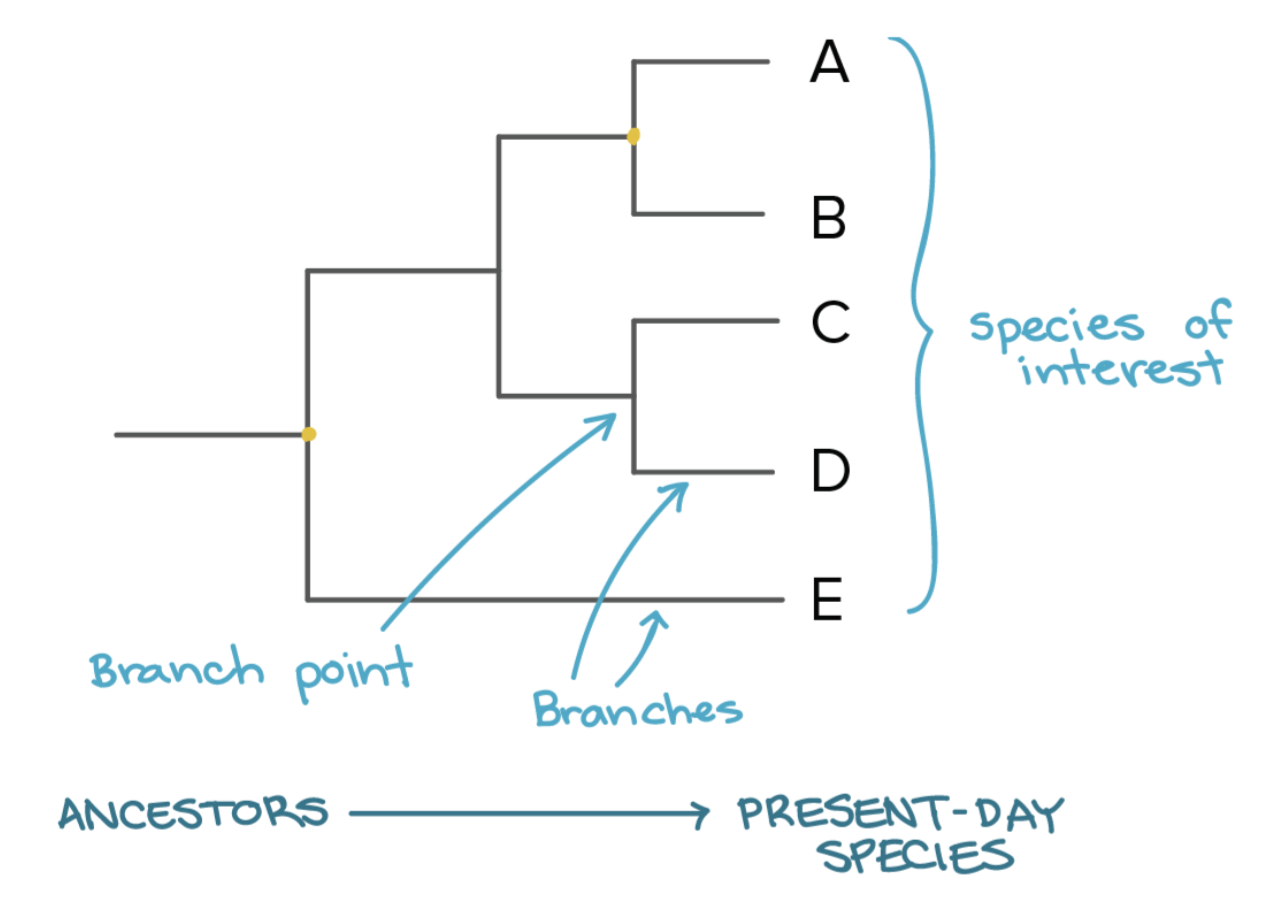
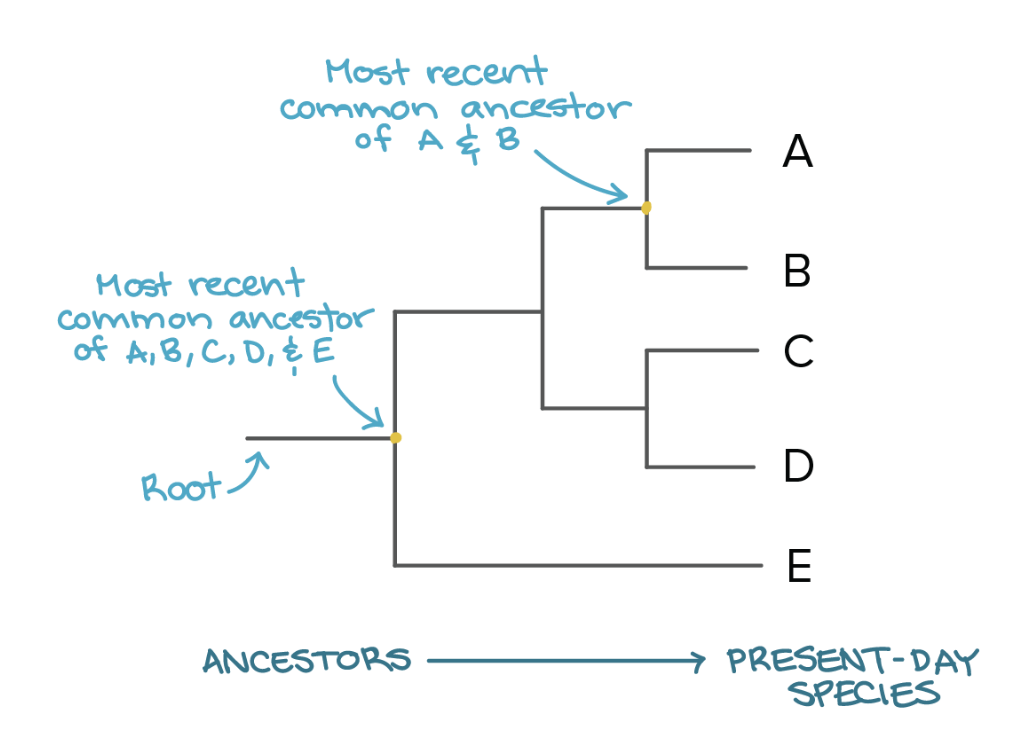
Using this structure of a basic phylogenetic tree, we can see that branch points represent the common ancestor of species that follow. Phylogenetic trees are unique from cladograms as their branch length typically represents the amount of time or genetic change during evolution, while cladograms do not. Thus, the main purpose of phylogenetic trees in mapping evolution is to account for time passing and the molecular clock during evolution. Scientists use data from fossils and genetic information to calculate the time that has passed, which is discussed more in this article [7.6 & 7.7]!
According to the biological species concept, a species is a group of organisms capable of interbreeding and exchanging genetic information to produce viable, fertile offspring.
Speciation is the process by which a new species forms, leading to the diversity of life forms. Speciation occurs when two populations become reproductively isolated from each other, a process that will be covered in more depth later in the article.
It is important to note that branches spreading from common ancestors contain several species that led to the present-day species of interest (A, B, C, D, E). This is an important idea to understand in the context of evolutionary history. The branching of a species represents speciation, which is the process by which a new species forms, leading to the diversity of life forms. Speciation will further be discussed in this article [7.10]!
The evolution of present-day species occurred from ancestors that may be similar in form and shared characteristics, but gradually underwent natural selection across time to lead to the present-day species we represent at the ends of the phylogenetic tree.
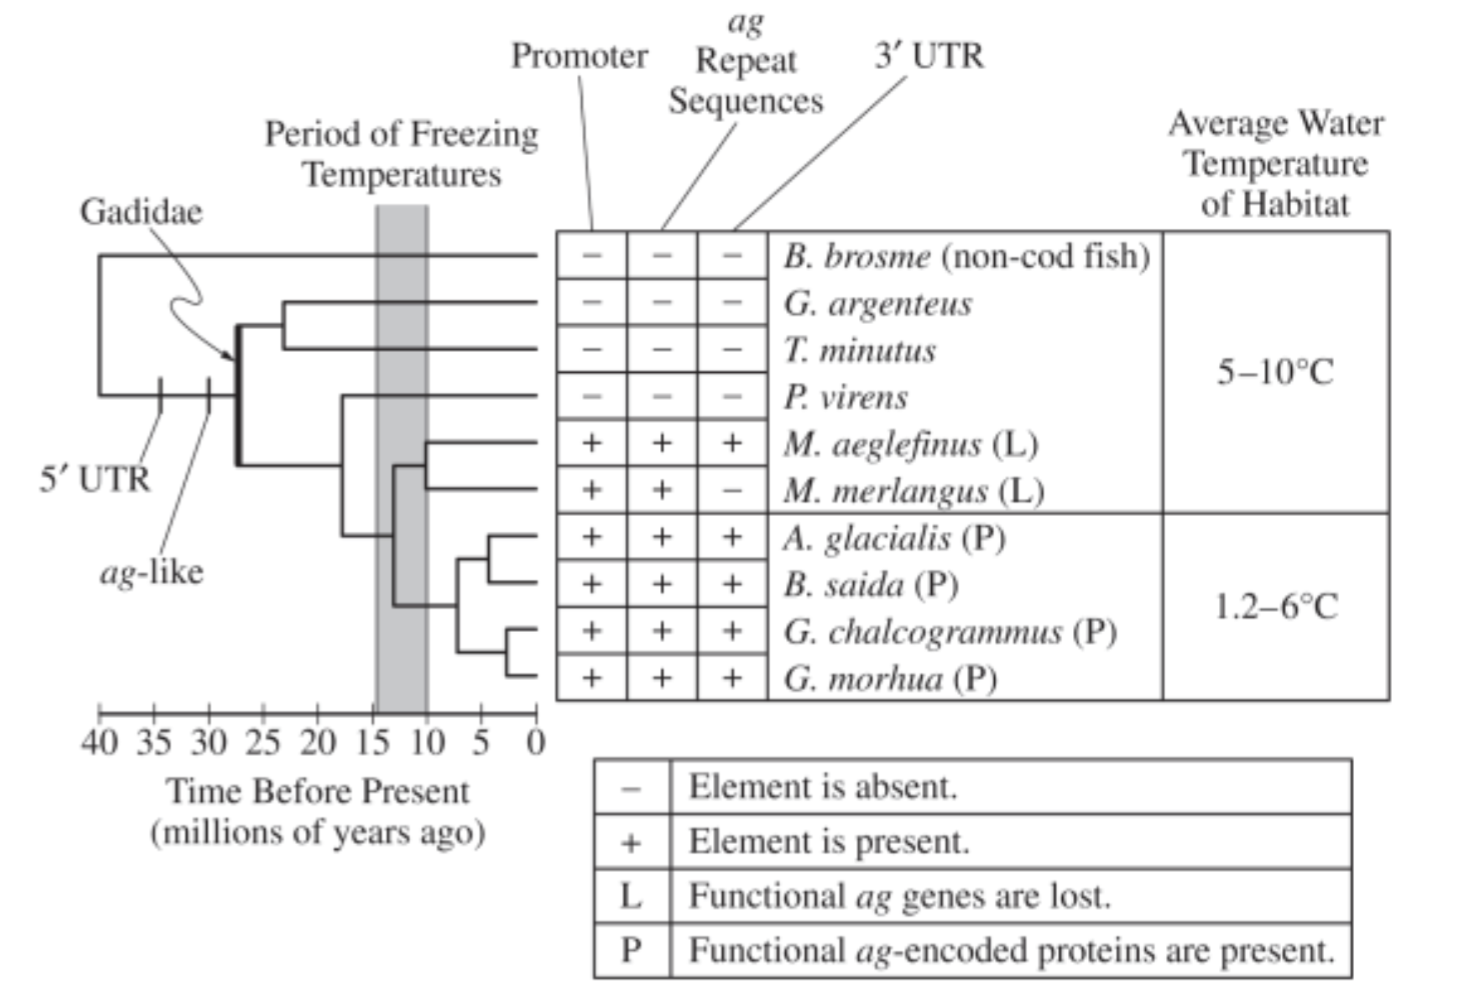
The figure above illustrates a true phylogenetic tree, indicating:
- Time since divergence from common ancestors
- Molecular data
- Molecular clock
Phylogenetic trees may be drawn horizontally, vertically, or diagonally, but the branching order (not the direction of the drawing) is what indicates relatedness. The following figure represents the previous tree diagonally, while maintaining the same relationships. You’ll often see evolutionary relationships for certain traits represented this way on the AP Biology exam:
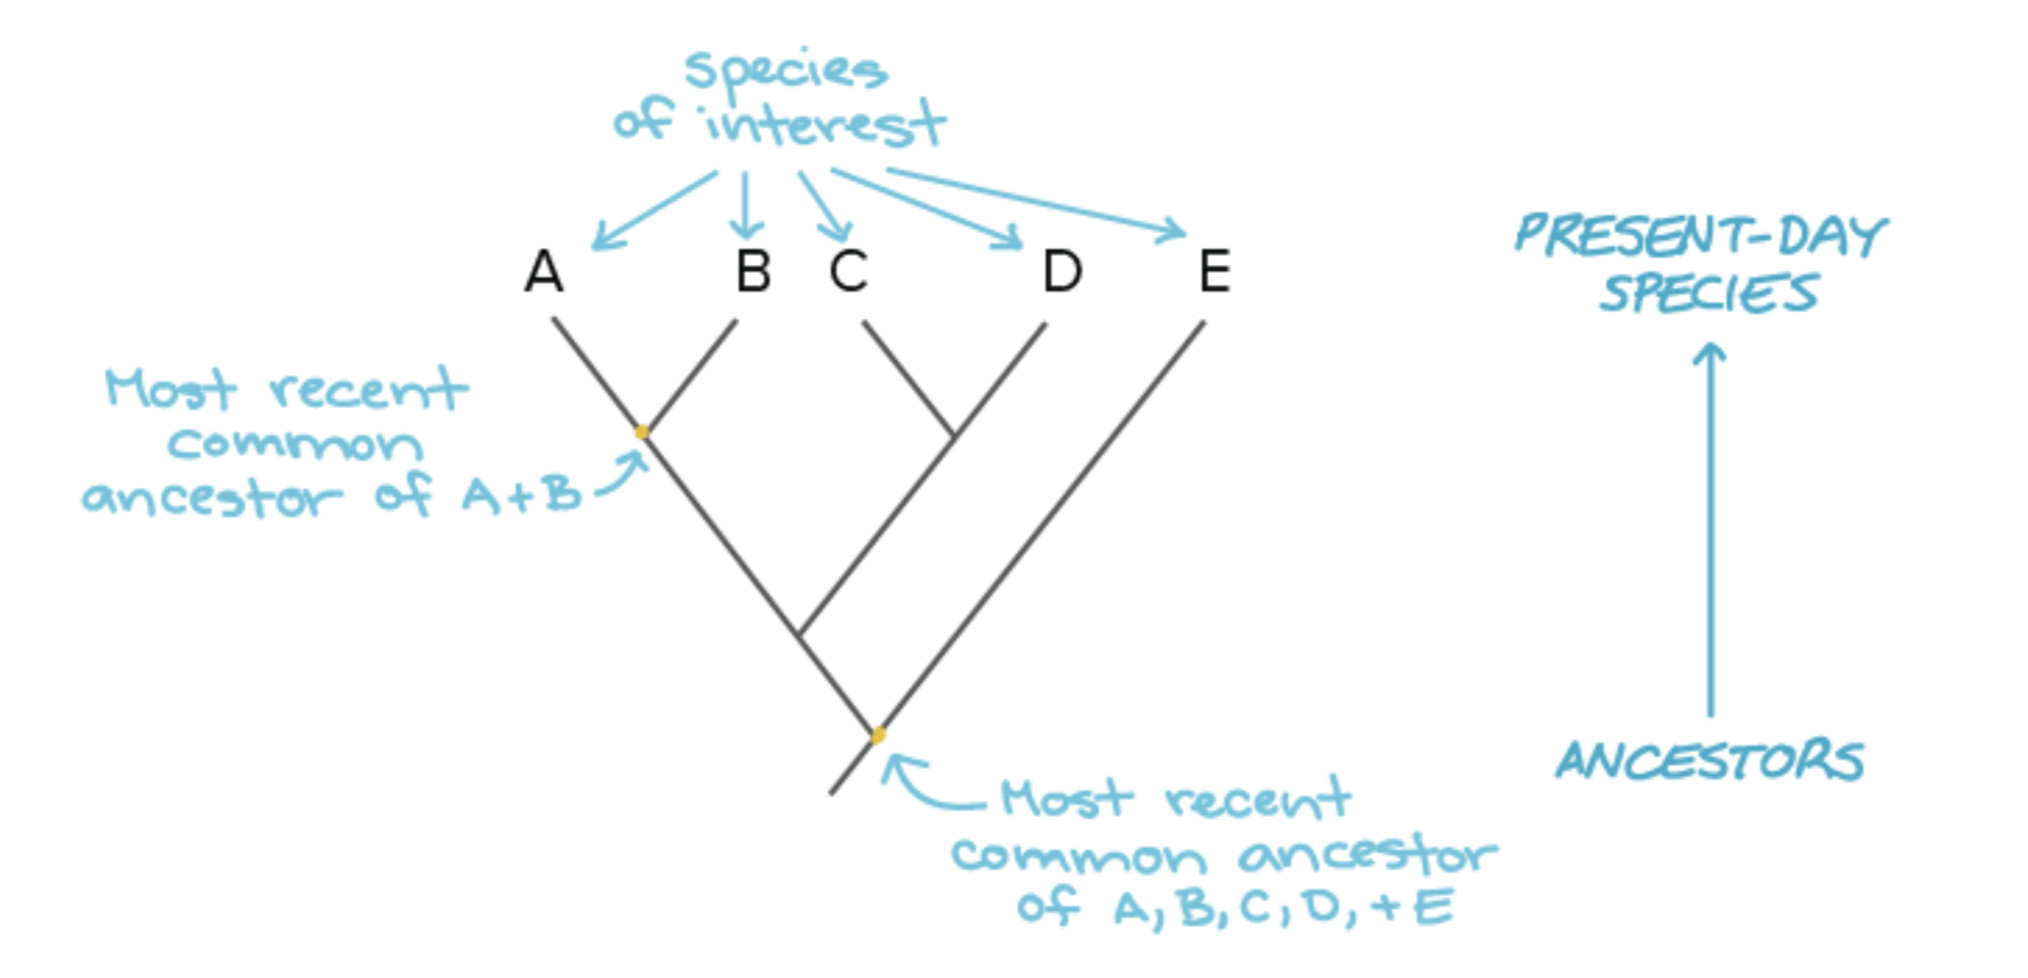
As stated earlier, it's important to distinguish phylogenetic trees from cladograms, which don't account for time or genetic differences between species. Cladograms more often are based on shared derived traits (traits different from the ancestral species) rather than molecular data and other important evolutionary information like fossils. Derived traits are often represented using hash marks on the cladogram. In cladograms nodes are the intersection points that represent the most common ancestors of any two lineages and clades are all descendants of a certain common ancestor. As noted in the image, A and B would be in the same clade if the specified node was the intersection point between A and B.
What is confusing for students is that genetic information can be used to construct BOTH cladograms and phylogenetic trees–the distinction lies in how the data is interpreted.
When molecular data (such as DNA or amino acid sequences) are interpreted as discrete shared traits (ex: presence or absence of a mutation) OR used only to determine relative relatedness, they are used to construct a cladogram. When the same kinds of data are used to represent evolutionary change over time or genetic divergence with meaningful branch lengths, they can be used to construct a phylogenetic tree. Both cladograms and phylogenetic trees can be constructed with traits that are either gained or lost over time during evolution. Thus, the construction/interpretation of cladograms from molecular data to infer relatedness between species is a very important skill to know in preparation for the AP Biology Exam. Equally as important is being able to interpret phylogenetic trees in order to determine evolutionary histories.
Now, let’s practice using a real item from the AP Biology CED step by step.
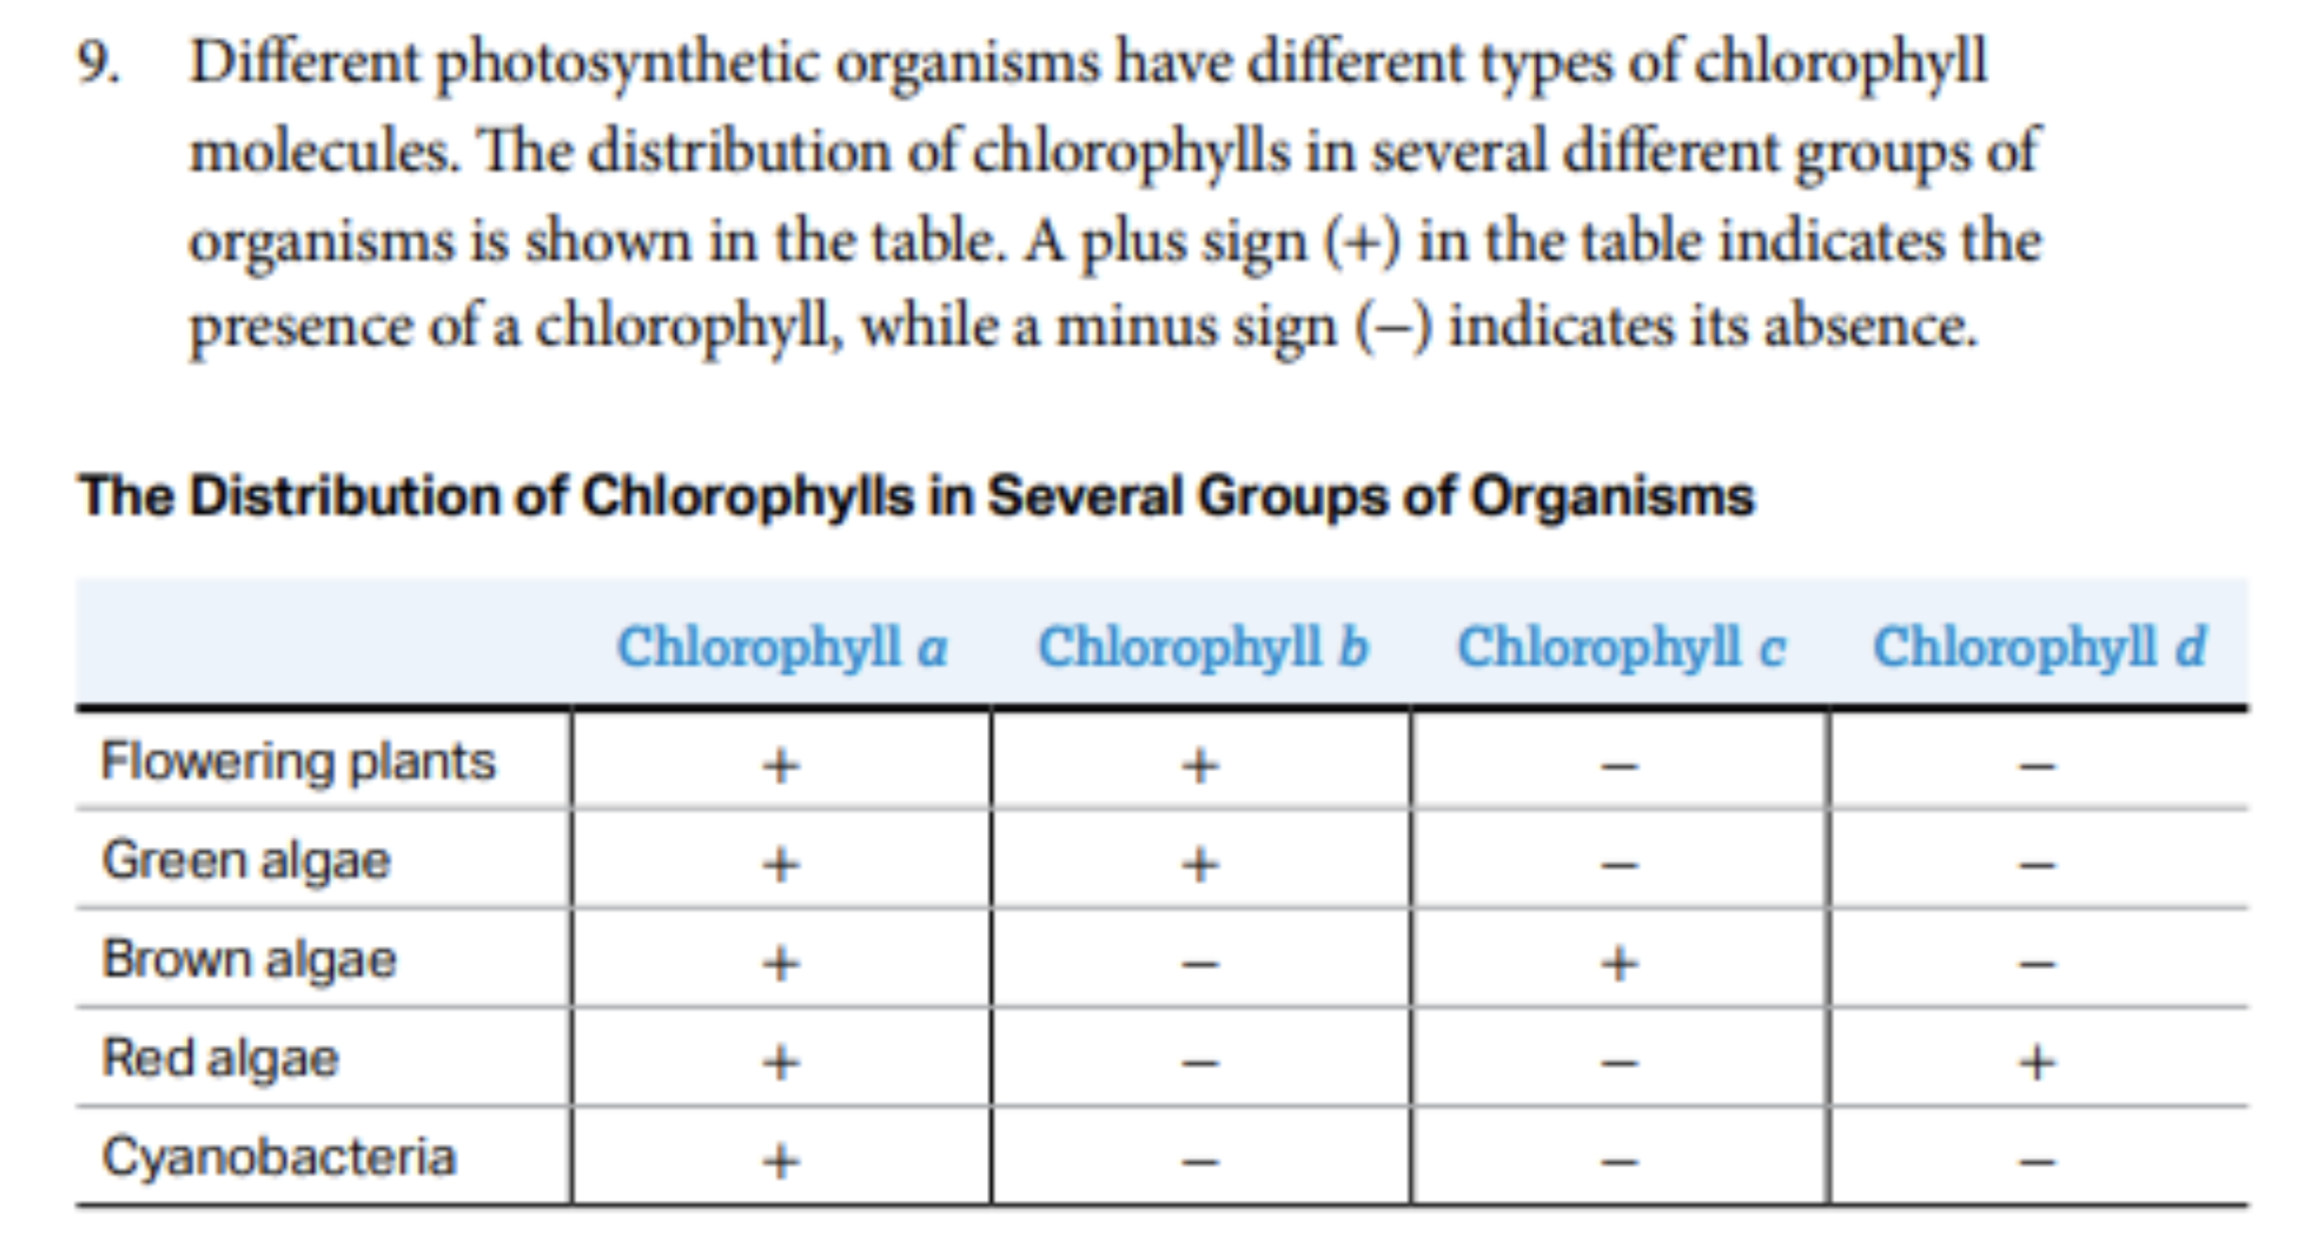
- Step 1: Find the ancestral trait
A good first step is to look for the traits shared by all groups. In this case, chlorophyll a is present in every organism. Chlorophyll a is not useful for separating groups here, since it is the ancestral/shared trait. This means we do not use chlorophyll a to make branches.
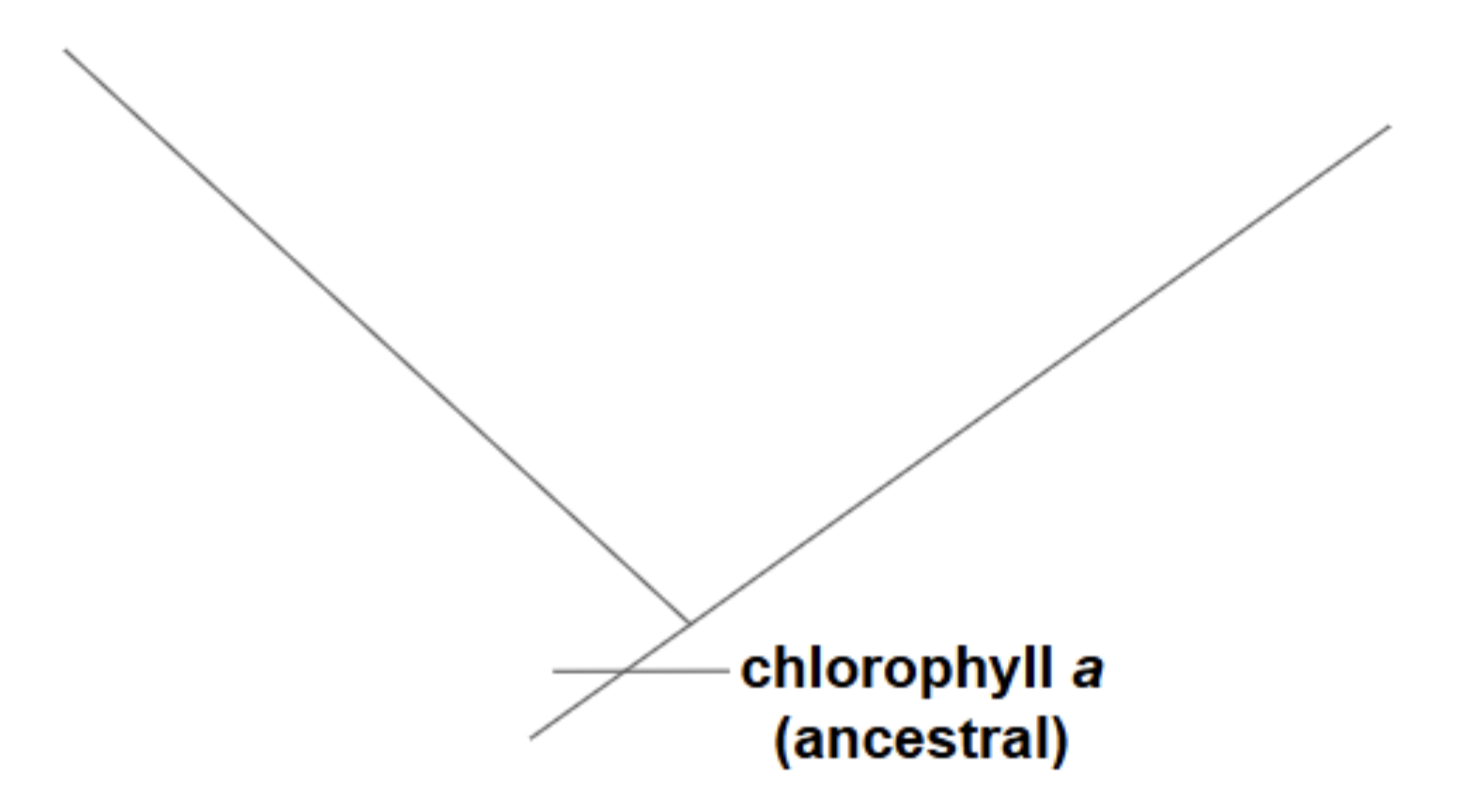
- Step 2: Find the derived traits
Now, we want to look for traits that are present in only some groups (derived).
Chlorophyll b : flowering plants, green algae
Chlorophyll c : brown algae only
Chlorophyll d : red algae only
- Step 3: Identify the outgroup
The outgroup is usually the organism with the fewest derived traits.
In this example, cyanobacteria contain only the ancestral trait (chlorophyll a) and none of the derived traits (chlorophyll b, c, d).
Thus, we can assign cyanobacteria as the outgroup.
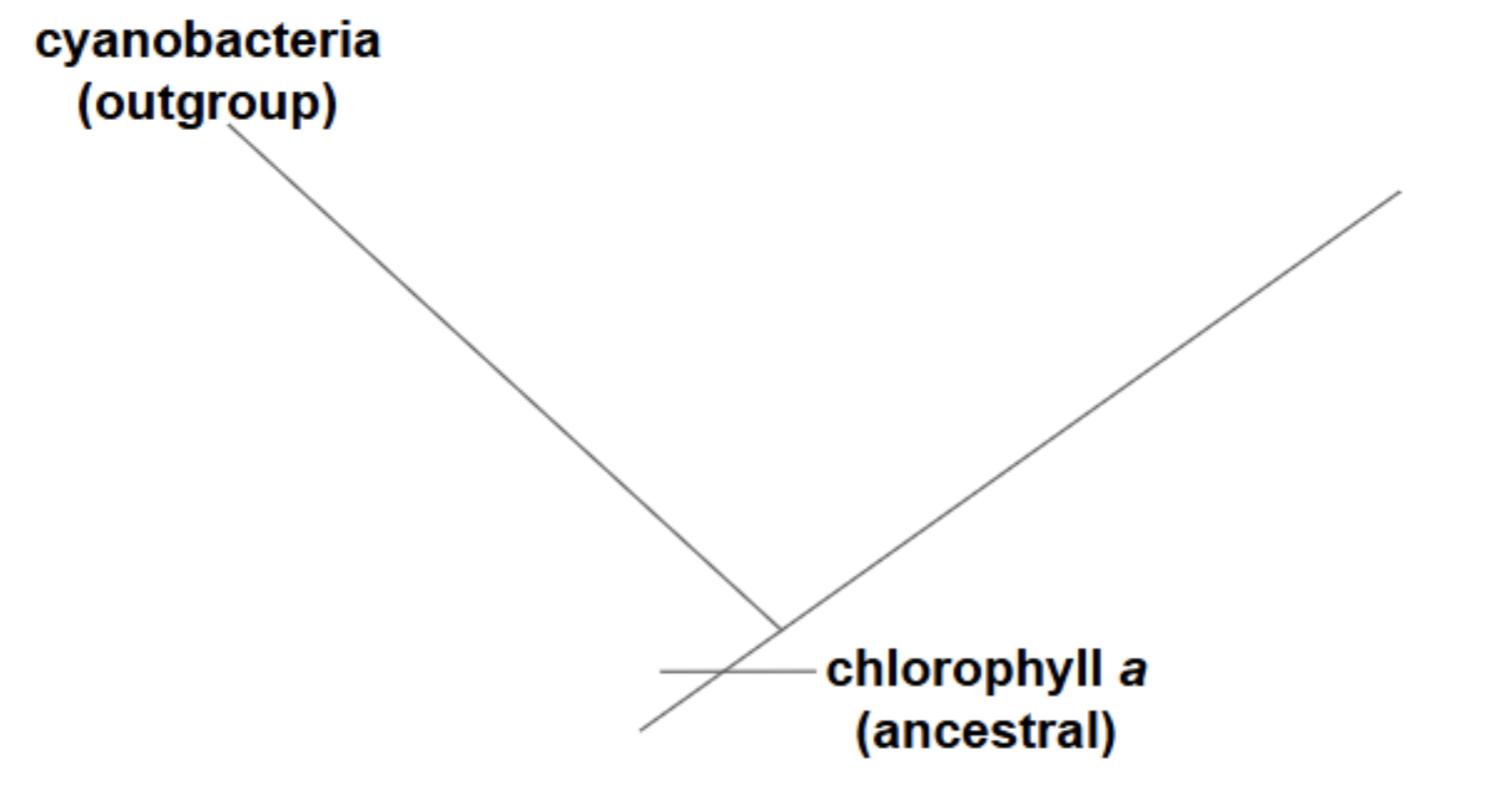
- Step 4: Group organisms by shared derived traits
Flowering plants and green algae both contain chlorophyll a and b, and neither has chlorophyll c or d. So, these clearly go together as a clade based on chlorophyll b.
Brown algae only has chlorophyll c, and red algae only has chlorophyll d. So, brown algae and red algae do not group together based on this matrix. Each has its own unique derived trait.
- Step 5: Determine the branching order
After cyanobacteria branches off, the rest split off according to derived traits:
One branch leads to brown algae from chlorophyll c
One branch leads to red algae from chlorophyll d
One branch leads to the clade of green algae and flowering plants
from chlorophyll b.
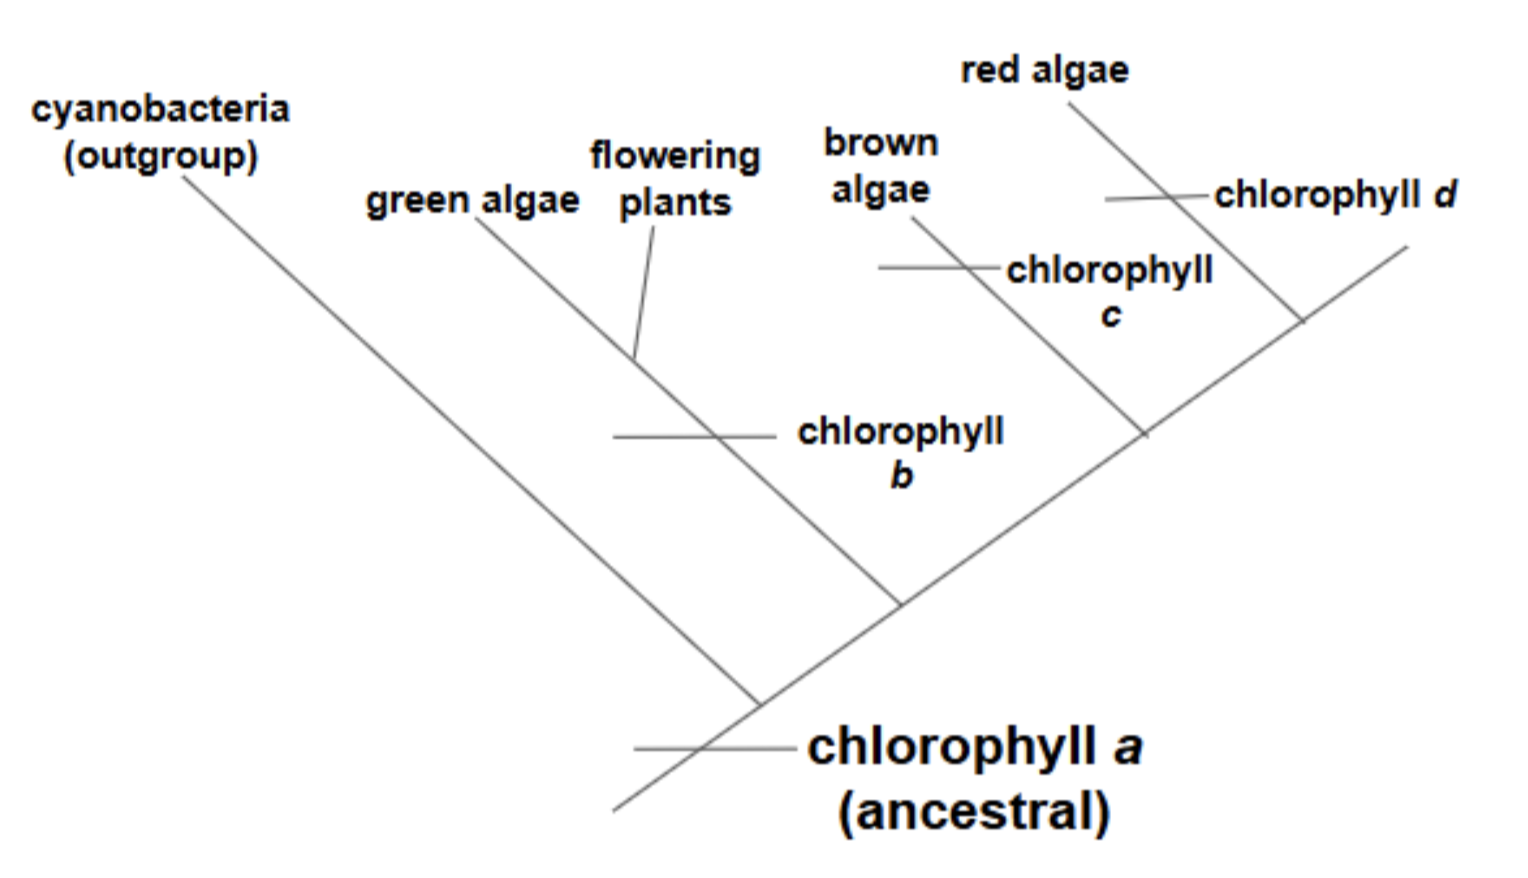
The figure above shows the completed cladogram.
Note: In this example, the branching order after the outgroup does not matter because the available data do not provide evidence for a specific sequence of divergence among those lineages. The hashmark on the base of the cladogram (chlorophyll a) is a trait shared by all organisms in the group. However, as lineages diverged, they gave rise to the use of different chlorophylls (b, c, and d). This reinforces the idea that cladograms represent patterns of shared ancestry, not the exact order of branching unless supported by shared derived characters; therefore, multiple branching arrangements that preserve the same clades are equally valid.
Ultimately, phylogeny allows us to visualize evolution and family trees on large scales, like showing how we’re related to fish, and on small scales, like your own family tree. As discussed in this article [7.6 & 7.7], there’s several forms of evidence for evolution that scientists constantly use to revise phylogenetic trees and cladograms. Both phylogenetic trees and cladograms are important in understanding evolution and are likely to show up on the exam.
[!] For more practice using both cladograms AND phylogenetic trees, try the 2018 AP Biology Free Response question #1.