
Introduction
Welcome to this article on AP Chemistry 3.5: Kinetic Molecular Theory. In this lesson, we will explore the behaviors of gas using particle models, understanding how kinetic energy, temperature, and collisions can affect pressure and volume. The Kinetic Molecular Theory discusses relationships between the volume and temperature, discussing how both affect the kinetic energy of the particles.
What is Kinetic Molecular Theory?
Kinetic Molecular Theory (KMT) is a theory that explains the macroscopic behavior of gases at the molecular level. The theory helps us understand relationships between volume, pressure, and temperature as seen in different gas laws. In KMT, we will look at the translational kinetic energy, which is the energy of movement of molecules. KMT establishes the set of rules that govern motions on a particulate level.
Key Concepts of KMT:
- The average kinetic energy of the particles is proportional to the temperature.
- Gas particles move in a constant, randomized motion and when they collide against each other, they collide elastically, where no kinetic energy is lost.
- Particles exert no intermolecular forces on each other. In other words, gas particles don't attract or repel each other.
-
The collision of particles with container walls causes pressure exerted by the gas:
- Pressure of gas is caused by collisions of particles with the walls of the containers. More collisions means higher pressure.
- The volume of individual particles is negligible. This means that the volume of individual gas particles is assumed to be zero.
Kinetic Energy of Gaseous Particles:
This equation defines the kinetic energy of a particle due to its movement, as for an object to move, it has to have work exerted on it, thus increasing its internal energy by virtue of Newton’s first law. Where:
- is kinetic energy
- is mass
- is the velocity.
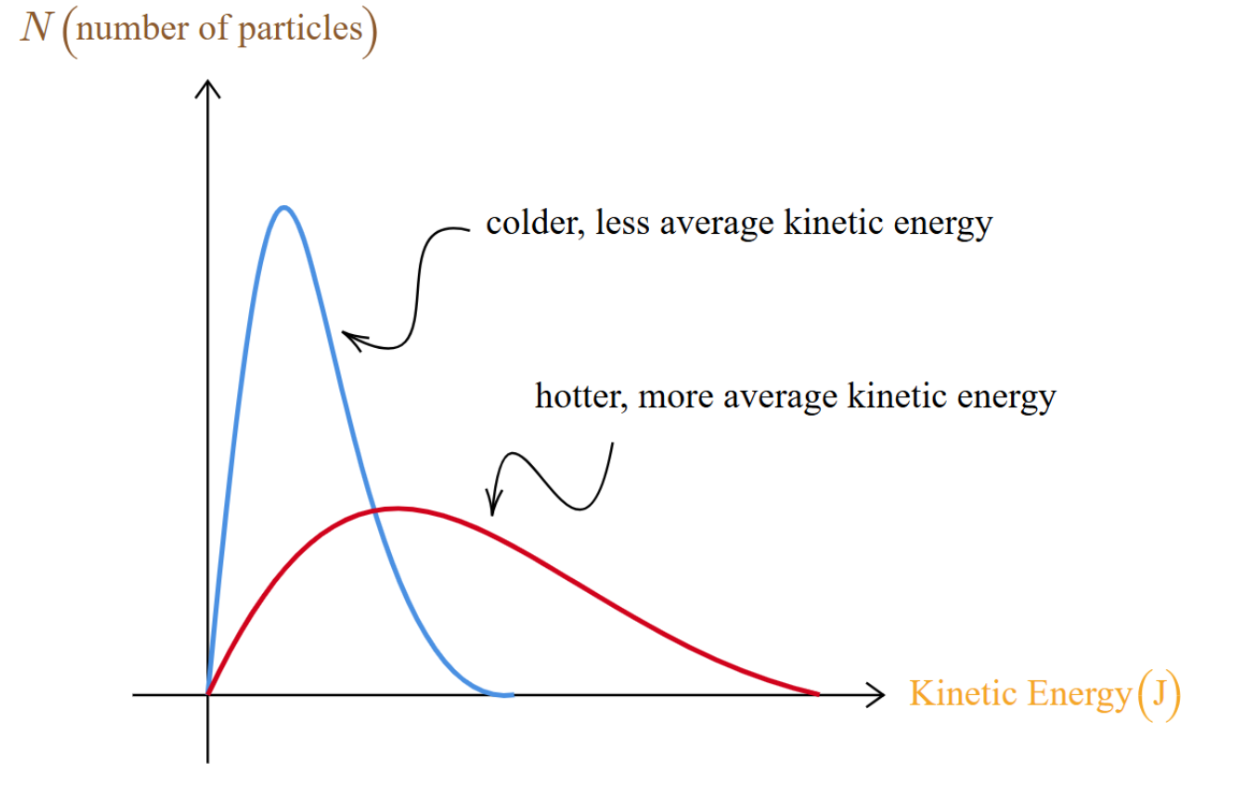
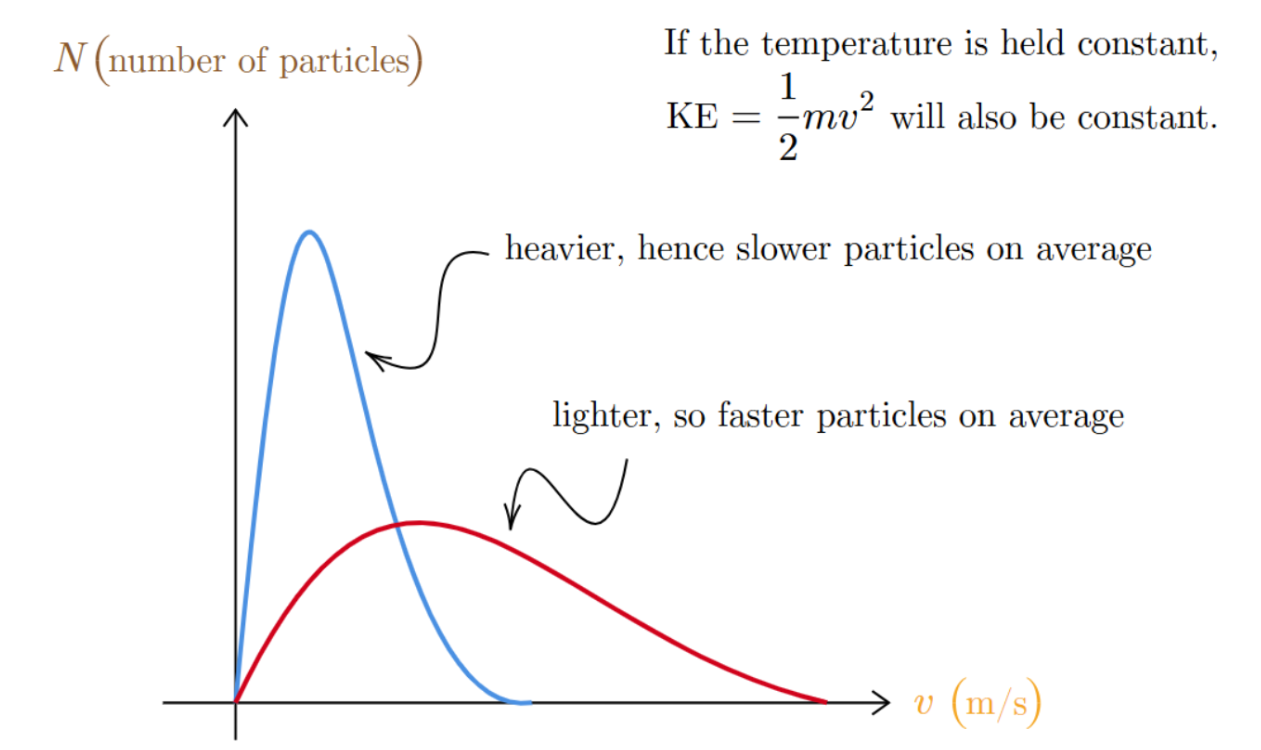
A Maxwell-Boltzmann distribution shows the relationship between temperature and average kinetic energy (KE). The -axis is the speed of the molecules, and the -axis is the number of molecules. Remember that this is a distribution; the graph is displaying the number of molecules traveling at a specific speed. The peak of the blue, cold gas is high but at a much lower temperature. The area under each curve is equal, as the number of particles in each system is still the same!