
AP Precalculus Unit 2 Cram Guide
Topic 2.1 - Changes in Arithmetic and Geometric Sequences
-
Sequences are like functions, but only non-negative whole numbers can be plugged into them.
- The graph of sequences are dots instead of curves
- There are two types of sequences: arithmetic and geometric
-
Arithmetic:
- Arithmetic sequences have a common difference between consecutive/successive terms.
- The difference between the second and first term of an arithmetic sequence will be the same as the difference between the third and second term of an arithmetic sequence.
- Arithmetic sequences are represented as , where is the zeroth, or initial term, and is the -th term, and represents the common difference.
- Compare any two terms in a sequence using , where and are two different terms of the sequence.
-
Geometric:
- Geometric sequences have a common ratio rather than a common difference.
- The ratio between the second and first term of a geometric sequence will be the same as the ratio between the third and second term of a geometric sequence.
- Geometric sequences are represented as , where is the zeroth, or initial term, and is the -th term, and represents the common ratio.
- Compare any two terms in a sequence using , where and are two different terms of the sequence.
-
Arithmetic and geometric sequences change in different ways.
- An arithmetic sequence may look like this: , , , .
- A geometric sequence may look like this: , , , , .
- Importance: Arithmetic sequences change equally with each step, but geometric sequences change proportionally with each step.
Topic 2.2 - Changes in Linear and Exponential Functions
-
Arithmetic sequences can be represented as linear functions, and geometric sequences can be represented as exponential functions.
- This extends sequences to a domain of all real numbers using functions.
-
Linear Functions:
-
Linear functions are represented as .
- Similar in form to . and work the same way as an initial value, and and work the same way as a common difference or slope.
-
To compare two points on a linear function, use
- Similar in form to . and work the same way, and with work the same way.
- Both linear functions and arithmetic sequences are based on addition and a constant change of value.
-
Linear functions are represented as .
-
Exponential Functions:
-
Exponential functions are represented as . The value of cannot be or
- Similar in form to , as and both represent initial value and and represent the common ratio.
-
To compare two points on an exponential function, use
- Similar in form to . and are similar in function, and and work the same way.
- Both exponential functions and geometric sequences are based on multiplication.
-
Exponential functions are represented as . The value of cannot be or
-
Identify linear and exponential functions by looking at equal-length input-value intervals. Compare the difference of the function over the same length.
-
From to and to , we can compare the difference between these two.
- If the difference between and is the same as the difference between and , the function is linear.
- If they change proportionally , then the function is exponential.
-
From to and to , we can compare the difference between these two.
Topic 2.3 - Exponential Functions
-
Exponential functions have the general form of .
- The initial value, or -intercept, is , and the base is . The value of cannot be zero, and the value of cannot be negative or one.
- The domain of an exponential function is all real numbers.
-
The output values of exponential functions are proportional for equal-length input-value intervals.
- Exponential functions are always either increasing or decreasing, meaning that they have no local extrema.
- Exponential functions are either always concave up or down, meaning that they have no inflection points.
- If the output values of an exponential function are not proportional over equal-length input-values, the function is shifted up or down.
-
Exponential functions have two different behaviors:
- If and , then the function demonstrates exponential growth. This means that the function increases in value as increases.
- If and , then the function demonstrates exponential decay. This means that the function decreases in value as increases.
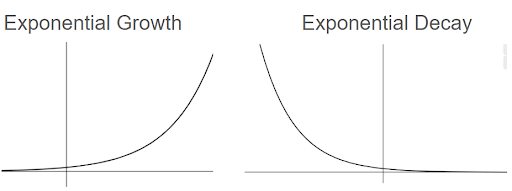
- The end behavior of exponential functions can either be infinity, negative infinity, or zero. The following table shows how different conditions lead to different end behaviors.
Topic 2.4 - Exponential Function Manipulation
-
Product Property:
-
Identical to a horizontal translation of an exponential function.
- Implies that a horizontal translation is the same as a vertical dilation.
- If , .
- Power Property:
- .
-
Identical to a horizontal dilation of an exponential function.
- If , then .
- Negative exponent property:
- This changes the negative exponent into a fraction with a positive exponent.
- Fractional exponent to a root:
-
- For example, is the same as the third root of
Topic 2.5 - Exponential Function Context and Data Modeling
-
Exponential models can be constructed based on the context.
- is seen as a growth factor or a percent change.
-
For example, a word problem can state that a bank account has a interest every year beginning with dollars.
- The interest implies that the base is , since every year results in a increase.
- The initial value is . Therefore, the function is .
- In many contexts, the base will be the natural base , which is around .
-
Domain restrictions can be established based on the context.
-
For example, an exponential function based on time cannot have because that would be negative time.
- The domain restriction for such would not include negative inputs.
-
For example, an exponential function based on time cannot have because that would be negative time.
-
An exponential function’s unit of time may be changed depending on the question.
- For example, the function represents the number of subscribers a channel has every day.
-
If a question asks for an interpretation in weeks, the exponential function’s unit of time will have to be changed from days to weeks.
-
The function can be modified to be
- represents one week’s time (increasing by is equivalent to days, or one week)
- is the base to represent one week’s change.
-
The function can be modified to be
Topic 2.6 - Competing Function Model Validation
- Data sets can be represented by linear, quadratic, and exponential functions.
- Context and applicability can be used to determine which one of these models are appropriate for the problem.
-
The residual describes the difference between the observed/actual value and the predicted value from a model.
- A positive residual means that the actual value is greater than the predicted value.
- A negative residual means that the actual value is less than the predicted value.
-
A residual plot graphs the residuals with the residual on the vertical axis and the independent variable on the horizontal axis.
- The model is shown to be appropriate if the plot does not have an apparent pattern.
-
In certain contexts, an overestimate or underestimate is more preferred.
- You would rather overestimate how much food is prepared at the party.
- You may prefer to underestimate your paycheck so you have enough buffer for necessities and wants.
Topic 2.7 - Composition of Functions
- Composite functions are represented in two ways that mean the same thing. and
-
The composite function takes the output of as the input of .
- As such, the domain is restricted to the domain of and the domain of . The output of the inner function () must lie in the outer function ().
- Values of the composite function can be calculated from knowing the function, having numerical data, or from a graph of both functions.
-
Composite functions are not commutative.
- is not necessarily equal to .
- and are usually distinct functions with distinct values.
-
If either or is equal to , then the function will always equal the function that is not equal to .
- For example, take the functions and . The composite function is also .
-
Because , . As such, .
-
The function is called the identity function.
- Identity functions act similar as the zero in , or the one in .
-
The function is called the identity function.
-
In contextual problems, there can be a relation between two different quantities that are not directly chained together.
- For example, can represent the number of customers per day, and is the profit per customer.
- The composite function would represent the profit per day.
- If and , then plugging in into the composite function gives a function that relates profit and days. .
- Furthermore, the function can be represented as tables.
-
Composite functions can be reversed back to their original functions.
- can be split into two components: and .
-
Composite functions can be transformed the same way through translations or dilations.
- Horizontal translations come from plugged into , making shifted units to the left.
- Vertical translations come from adding to the whole composite function of , making shifted units upwards.
- Horizontal dilations come from plugged into , making compressed by a factor of .
- Vertical dilations come from multiplying to the whole composite function of , making dilated by a factor of vertically.
Topic 2.8 - Inverse Functions
- Inverse functions are notated as .
-
A function that has an inverse has a property called invertible
-
Functions are only invertible if each output of has a unique input value.
- If and are equal, then is not invertible.
- In certain cases, the domain of can be altered to make the function invertible.
-
The context of the problem may restrict the domain further.
- For example, a function may represent an experiment in terms of population vs time. Time will have to be restricted to only non-negative values along with the necessary domain restrictions for invertibility.
-
Functions are only invertible if each output of has a unique input value.
-
Inverse functions take the output values of and give its input values.
- If , then .
- The coordinate on suggests that exists on , assuming that is invertible.
-
Switching the and values for can lead to finding the inverse.
-
From , the variables can be flipped to have .
- Solving for will yield .
-
From , the variables can be flipped to have .
- Graphically, the inverse of can be found by reflecting across the line, or what would be known as , the identity function.
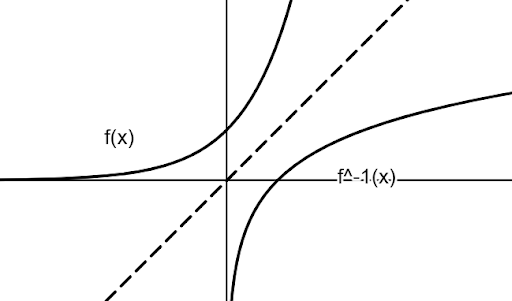
-
.
- For example, the inverse of is , where .
- Plugging in these values into the composite function yields .
Topic 2.9 - Logarithmic Expressions
- Logarithmic expressions are the inverse of exponential functions and are represented as .
-
For , is the base, is the exponent, and is the result of .
- The logarithm only holds if , where and are constants and and .
-
If a base is not written, then it is assumed to have .
- .
-
A log scale is a type of scale that uses logarithms to show multiplicative change instead of additive change.
- A typical scale is and so on.
- A log scale using base will have and so on. Different bases yield different numbers.
-
Logarithms may require technology to be solved.
- since .
-
will require technology, since cannot be solved through basic arithmetic.
- The value of is .
Topic 2.10 - Inverse of Exponential Functions
-
The inverse of exponential functions are logarithmic functions.
- Logarithmic functions have the general form with base , where and and .
-
We can show that exponential and logarithmic functions are inverses in various ways. All of these under the assumption that and .
-
From Topic 2.8, only holds if and are inverse functions.
- Plugging in and yields .
-
The graphical property of flipping functions over the line of holds.
- can be flipped over to yield .
-
If exists on , then exists on .
- For example, exists on . To show that exists on , plug in and solve for .
- , . As such, this property holds.
-
From Topic 2.8, only holds if and are inverse functions.
-
For exponential and logarithmic functions:
- When we increase the input of an exponential function by equal-length intervals, the output is multiplied by the base, meaning that the function changes proportionately.
-
When we increase the input of a logarithmic function proportionally, the output changes by equal-length intervals.
- For example, set and set . The table below demonstrates this property.
Topic 2.11 - Logarithmic Functions
- Logarithms are always either increasing or decreasing, and are either concave up or concave down, meaning that they have no local extrema or inflection point.
-
Take the logarithmic functions where and with .
- The function has a vertical asymptote at that goes towards positive or negative infinity.
-
As increases or decreases without bound, the function also goes towards positive or negative infinity. If one side goes towards one infinity, then the other side goes towards the other infinity.
- For example, if , then
-
Logarithmic functions have a property where outputs of equal-length intervals allow for proportional changes in the input.
- An output of in comes from plugging in
- An output of comes from plugging in
- An output of comes from plugging in .
- As the outputs change by equal lengths of one, the inputs change proportionally by a factor of .
-
Horizontal transformations can ruin this proportional relationship.
- If , the following table illustrates the inputs and outputs.
- The outputs change by equal length intervals of one, but the inputs no longer are proportional to each other.
Topic 2.12 - Logarithmic Function Manipulation
-
Product Property:
- .
-
If we have a horizontal dilation of , that would be the same as .
- This is a vertical shift of units up.
- A horizontal dilation is identical in effect to a vertical translation for a logarithmic function.
-
Power Property:
- .
- Raising the input of a logarithmic function by a power of is identical to vertically dilating the function by a factor of .
-
Change of Base Property:
- where and .
- The expressions and represent two different logarithmic functions, and they are related by the factor .
- Therefore, every single logarithmic function is related to each other through the change of base.
-
For a logarithmic function with the natural base , .
- Both and mean the same thing, just different notation.
Topic 2.13 - Exponential and Logarithmic Equations and Inequalities
-
The previous topics about exponential and logarithmic properties allow us to rewrite expressions and solve equations relating exponentials and logarithms.
- One rewriting to know is that .
-
Just like for quadratics, there are many times when extraneous solutions may appear.
-
After solving for possible values of , check if the solution is actually valid.
- For example, take the equation
- and
- Plugging in both of these, notice that is an extraneous solution since does not exist.
- Therefore, the answer is
-
After solving for possible values of , check if the solution is actually valid.
-
To find the inverse of logarithmic and exponential functions, recognize that both of these are inverses of each other.
- To remove a logarithmic, use exponentials. To remove an exponential, use logarithms. But otherwise, the same method of swapping the variables of and as described in Topic 2.8 can be used.
Topic 2.14 - Logarithmic Function Context and Data Modeling
- Logarithms can be used to illustrate a relationship of proportional growth, or repeated multiplication. Logarithms can be used to predict values for dependent values, and find values of independent variables.
-
There are three ways to construct logarithmic functions:
-
The first method is when the question gives the proportionality of the logarithm and the -intercept.
- For example, a question may say that for a logarithmic function, an each increase of in the output corresponds with the input tripling.
- If the input triples, the proportionality is three. Therefore, the base of the logarithm is .
- The question may state that the input is at . This is our real zero, and we can construct a logarithmic function with base that crosses the point .
- Secondly, receiving two points on the logarithm allows us to create a system of equations to solve for the constants in .
-
Finally, logarithmic regressions are approximations based on logarithmic functions that can be used to create predictions about a scenario.
-
These regressions are constructed using a data set that is inputted into technology like a graphing calculator or Desmos.
- More information about Desmos can be found on the Desmos guide [link]
-
These regressions are constructed using a data set that is inputted into technology like a graphing calculator or Desmos.
-
The first method is when the question gives the proportionality of the logarithm and the -intercept.
Topic 2.15 - Semi-log Plots
-
A semi-log plot is a plot that has one of the axes logarithmically scaled, usually being the -axis.
-
By scaling the -axis to follow a logarithmic scale, this means that one unit up represents proportions rather than constant rate of change.
- A standard -axis may look like , , , while a semi-log plot’s -axis can be something like , , , , .
- Semi-log plots are useful for turning exponential graphs into looking linear.
-
By scaling the -axis to follow a logarithmic scale, this means that one unit up represents proportions rather than constant rate of change.
-
We can demonstrate that exponential functions can be modeled by semi-log plots through the equation .
- Let us have .
- Using semi-log plots allows us to take the log of the function because of the scaling of the -axis.
- In this case, let us pick to scale the axis by . Therefore, we have the following table:
-
The relationship between and is exponential, while the relationship between and is linear.
- Having a linear graph allows us to do more alterations relating with linear functions, and treat such as a linear function.
-
We can further demonstrate that exponential functions can be modeled by semi-log plots through the equation and turning it into a linear function.
- Take the log of this function to be where and .
-
Notice that the final equation of is analogous to .
- The slope is and the -intercept is .
- Therefore, taking the logarithm of an exponential function will yield a linear function.